If you could avoid doing the grunt work of creating diagrams from scratch, why wouldn’t you do it? That was one of the reason’s behind the CSV import feature for draw.io.
Why use a diagram to display spreadsheet data?
Many different company departments and professionals work with data that is or can be represented in a table or spreadsheet format, and often, that data is more quickly understood when converted into a diagram.
- Business analysts can pull specific data sets from their databases with SQL queries and dump the results to a spreadsheet and save that as a CSV file. Automatically building a diagram from the CSV file can help them model relationships between types of data quickly.
- Human resource departments (HR) can export their staff contact details to a CSV file, perhaps directly from Active Directory, using a small script. They can then import this data into draw.io, and it will automatically build an organization chart.
- Software developers, IT help desks and project managers use a variety of issue tracking tools to keep on top of the tasks they need to complete in their projects. Many of these can export a table of issues to a CSV file, which can be used in draw.io to build a visual hierarchy – you can see clearly just how much work is involved in each area, and how the tasks relate to each other.
- Are you a novelist, trying to keep track of your characters or locations in a spreadsheet? Export this and import the CSV data into draw.io to see your character or location relationships visually.
- Or perhaps you are a technical writer or teacher using a different mindmapping tool to plan your training courses or manuals. These tools can usually export to a CSV file.
As you can see, a wide variety of professionals can and do use CSV files to store or work with their data. If you want to see that data visually, it’s easy to import it into draw.io.
Importing a CSV file into draw.io
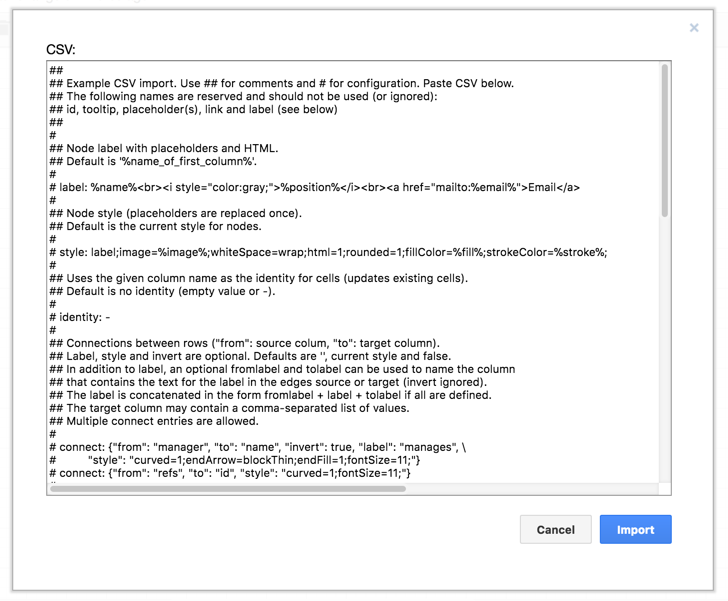
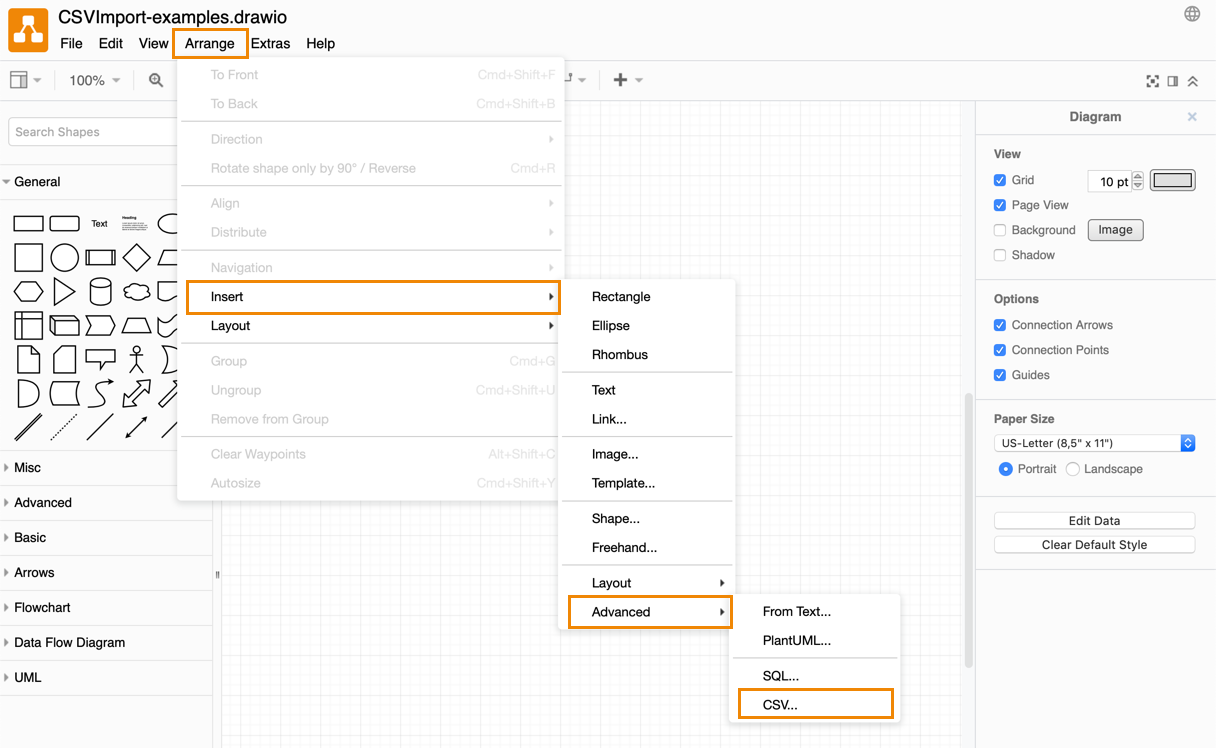
Click Arrange > Insert > Advanced > CSV and you’ll see the dialog with an example, showing you how you can customize the display of your CSV data. This example is of an organization chart.
Create the CSV file
First, let’s take a look at the CSV file.

Each row represents a shape, and the columns contain the shapes’ data. You can see that not all columns are included as data in the diagram – some of these columns tell draw.io how to format the shape, or are used as identifiers for drawing connectors between the shapes.
Set the formatting for the shapes
The example that is displayed when you open the CSV import dialog (in the screenshot above), explains how to use each formatting option. This will help you build your CSV table correctly.
The style and configuration of your diagram is set in the top section where each line begins with hash characters (#).
- An explanation of each option uses two hashes (##) at the beginning of each line.
- Configuration options are entered with a single hash character (#) at the beginning of the line.
Let’s take a closer look at how the shapes (rows) are connected.
# connect: {"from": "manager", "to": "name", "invert": true, "label": "manages", \

# "style": "curved=1;endArrow=blockThin;endFill=1;fontSize=11;"}

# connect: {"from": "refs", "to": "id", "style": "curved=1;fontSize=11;"}
You can see that one set of connectors are drawn in the direction ‘from‘ the ‘manager‘ table cells that contain a name to the shape (the row) with that name. This is why in our example we need to ‘invert‘ the connector arrows. For more about the ‘invert‘ option, see the notes below. We also apply the label ‘manages‘ to these connectors.
A second set of connectors links to any employee that has their ‘id‘ listed in the ‘refs‘ column in the table.
Both sets of connectors are curved and their labels use a font with a size of 11, but only the ‘manages‘ connectors have an arrow style that is not the default style.
Add your CSV data to the end of the formatting configuration
Open your finished CSV file in a text editor and copy it into the bottom of the CSV import dialog.
Important: Make sure there are no hash characters at the beginning of this data!
Click Import, and draw.io will automatically build your diagram from your CSV data and the configuration you entered above it.

Open the CSV file in a text editor, and copy all of the text.
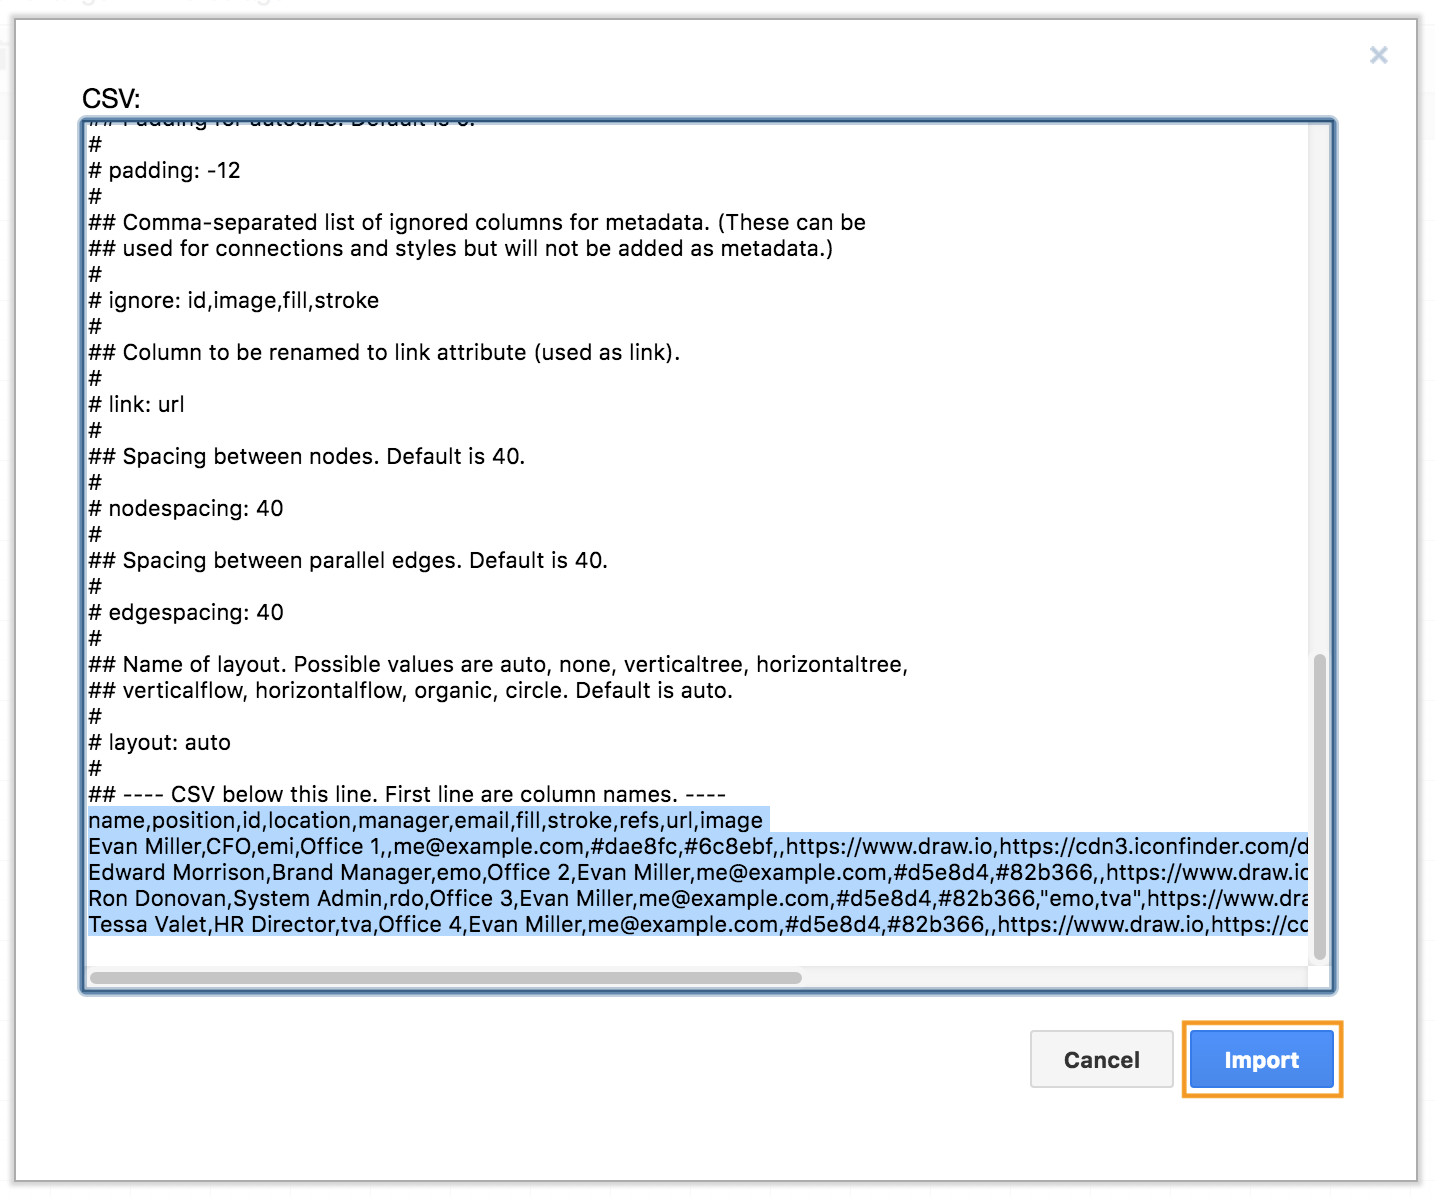
Scroll down in the CSV import dialog, and paste your data at the end.
Need a bit of help?
Those configuration options can be a bit confusing. I was very confused by the ‘invert’ option on the connectors in the example – my head doesn’t deal well with data in a spreadsheet format!
The best way to see how the configuration options work is to play with the example. Change some of the options and see what that does!
Inverting connectors
Why did we need to invert them when it was going ‘from’ the manager ‘to’ the employee?! That’s because the connector was drawn ‘from’ the employee (the manager cell in the employee’s row in the spreadsheet), to the shape with the name of the manager that was written there.
The organization chart on the left in the image below does not have inverted connectors, and the chart on the right does. Once I saw that, I understood how the diagram was drawn from the CSV data.
Using table columns for metadata and styles
As mentioned above, you don’t need to display every column of your CSV table in your diagram. Some of these columns can be used as metadata, or instructions for how to format a shape. For example:
# style: label;image=%image%;whiteSpace=wrap;html=1;rounded=1;fillColor=%fill%;strokeColor=%stroke%;
The columns image, fill and stroke are used to set the style of the shape – the image that is used and the color of the lines and background. We don’t want to display their text in the shape itself, so we have another configuration option to ignore them when drawing the shape. We also ignore the id column, as it is used as the target for the ref connectors.
# ignore: id,image,fill,stroke
Quickly create your diagram from your CSV file stored on the web and share it
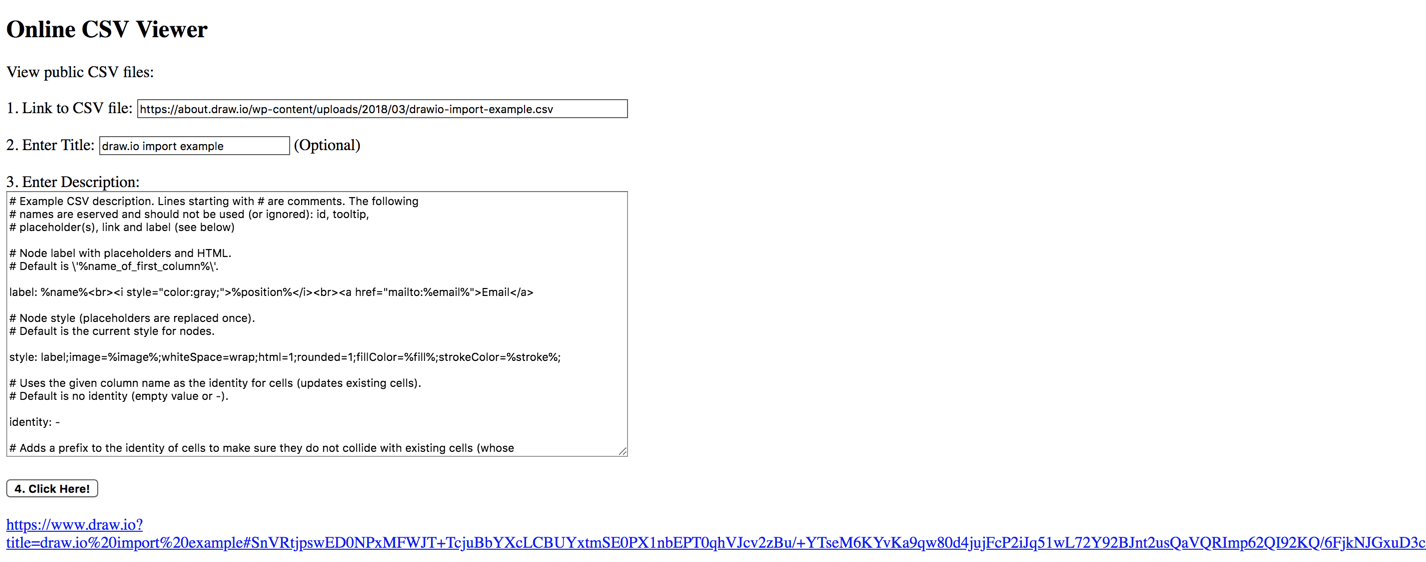
- Go to https://jgraph.github.io/drawio-tools/tools/csv.html
- Enter the link to CSV file.
- If you want, enter a title for your diagram.
- Format your diagram by editing the Description. The example is full of helpful comments.
- Click on Click here to generate a link.
You can now copy and share this (very long) link with your diagram viewers!
Interactive diagrams – navigate complex diagrams easily
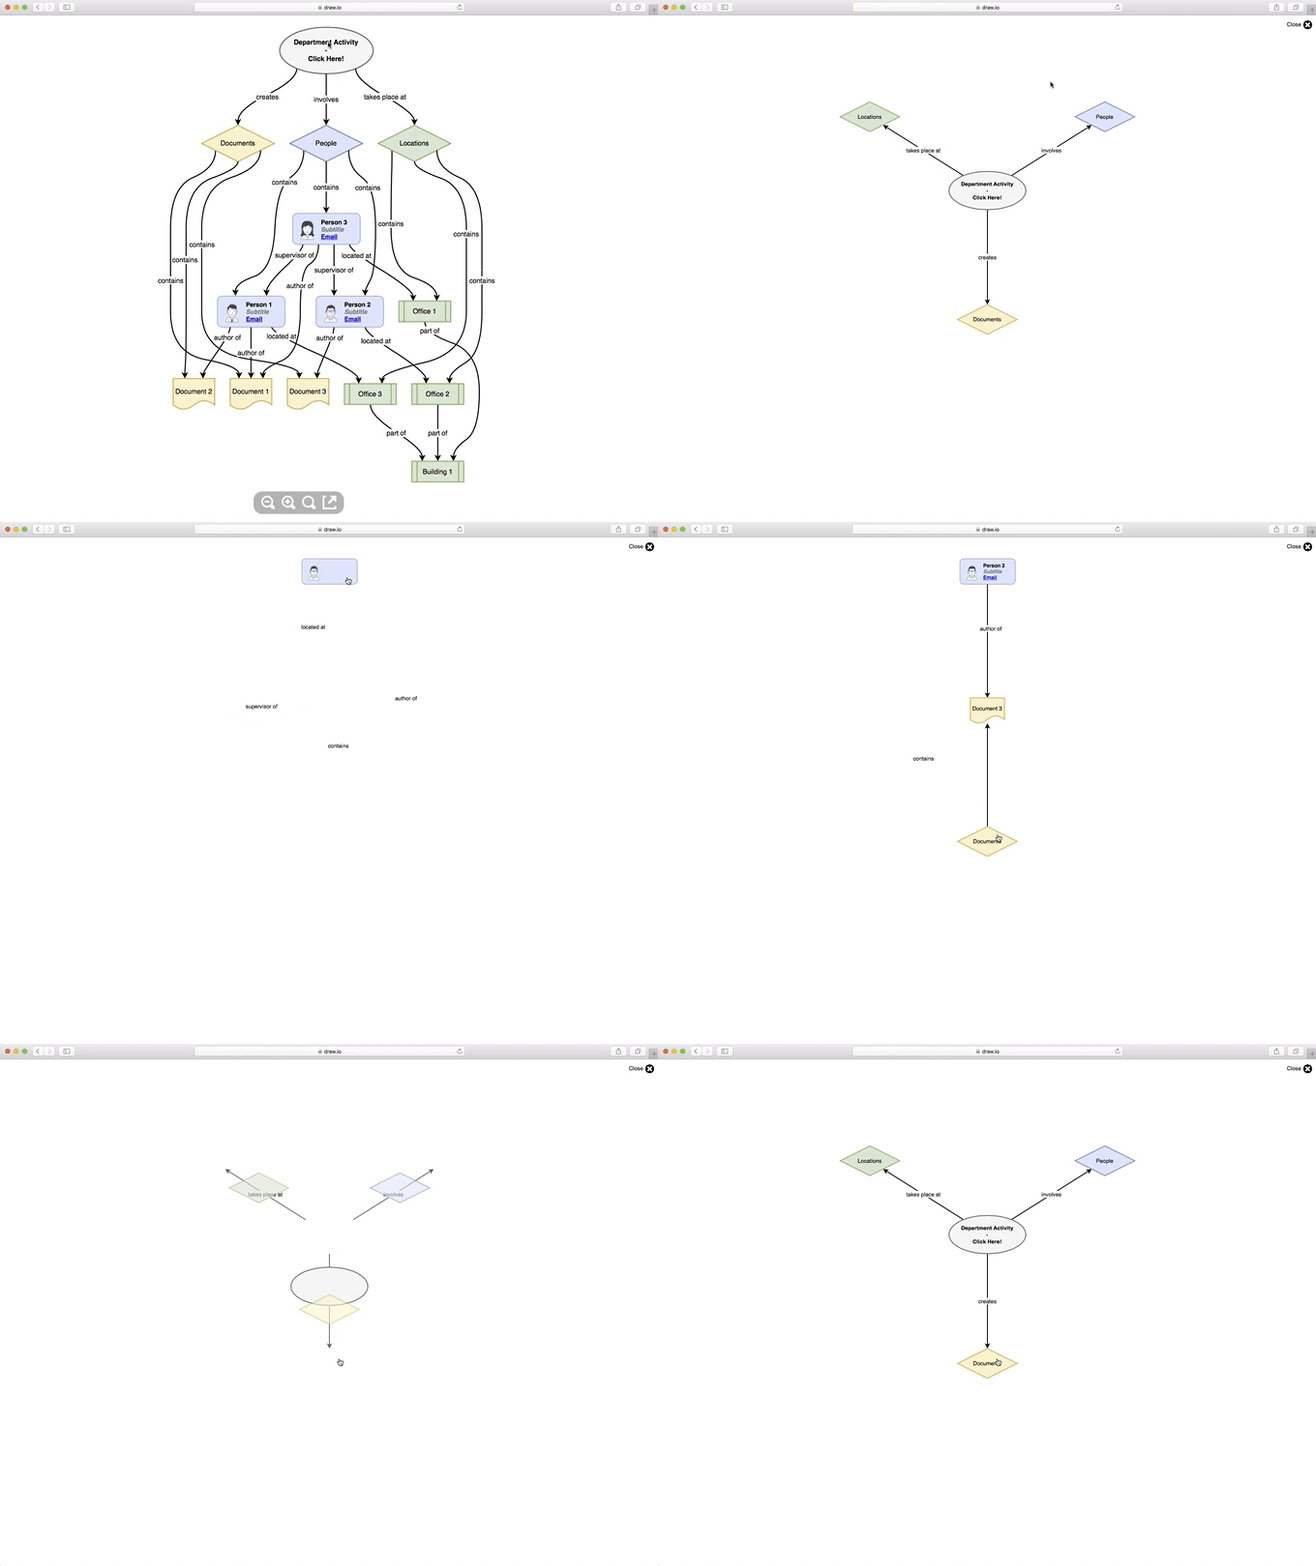
Make it easy for your new staff to navigate through your complex organization charts, or software engineers through detailed UML diagrams. draw.io lets you step through diagrams interactively – you simply need to use the explore draw.io plugin.
Last Updated on March 31, 2020 by Admin


