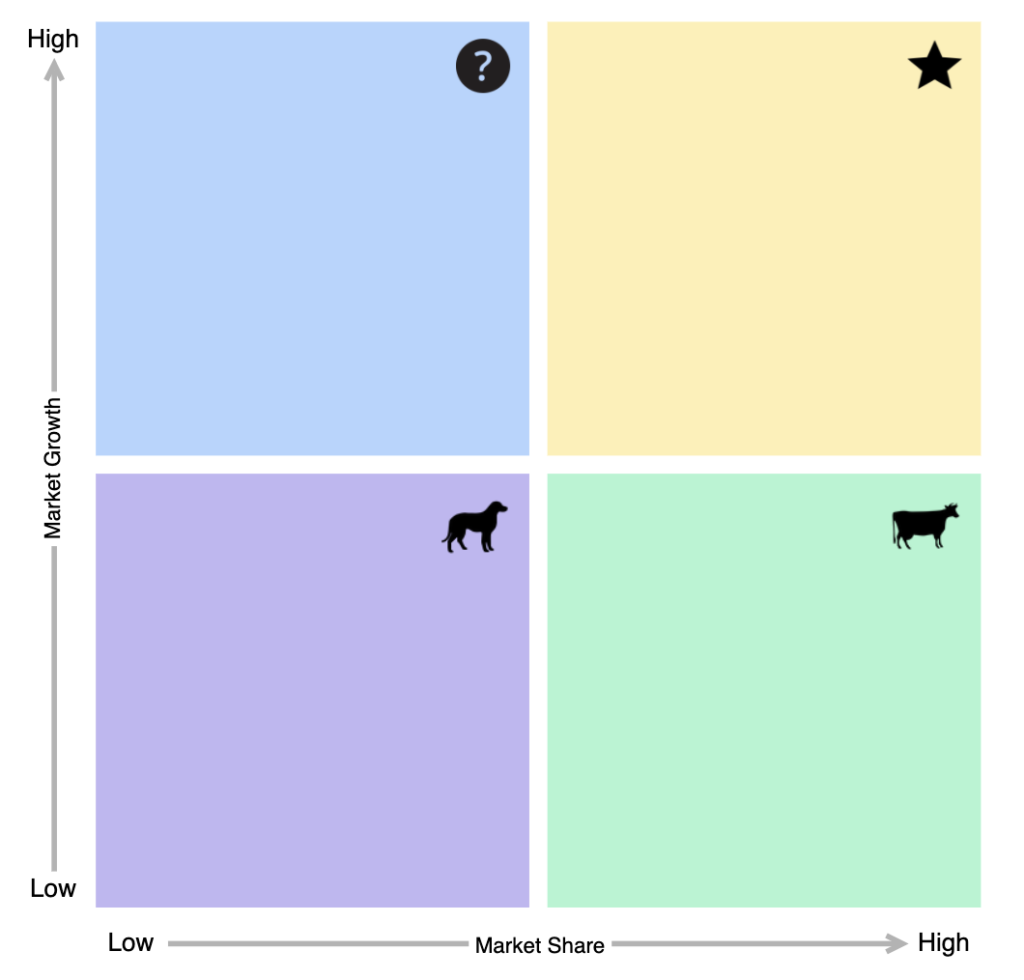
The Boston Consulting Group Matrix is a useful tool for identifying how all aspects of your company’s offerings are performing in relation to each other and to the larger market in general. It’s a growth-share matrix that takes into account relative market share as well as other considerations to categorize your product portfolio and business units into one of four quadrants. Does this product offering have a high or low market share? And what does that mean regarding its impact on overall profits now and in the future? The BCG Matrix can tell you what you need to know.
Download BCG Matrix template
So, let’s talk about how to create a BCG Matrix using draw.io. The first step is to download the draw.io BCG Matrix Template above and drag it into draw.io. Once the template has safely landed on your canvas, you’ll see something exactly like this:

And you’ve got all the tools you need to begin your Boston Matrix.
Now let’s talk a little about the Boston Consulting Group Matrix itself. What is it? How does it work? And when do we use it?
What is a Product Portfolio Matrix?
First, some background. Along with the Ansoff Matrix, the BCG model is one of the two most widely used business portfolio models that help you to more easily maximize the overall value of your product portfolio.
Both models are two-by-two matrices, but, while Ansoff labeled his according to market development, market penetration, diversification, and product development, the BCG Growth Matrix places products along a continuum on two axes — covering market growth from low to high on the vertical and low to high market share from left to right on the horizontal.
The resulting boxes are labeled as question marks, stars, cash cows, and dogs.
How to do a BCG analysis
Using the BCG Growth-Share Matrix is a relatively easy proposition. Simply identify market share and market growth numbers for each member of your product portfolio and place them into the appropriate box.
Cash cows: A cash cow is a market-leading product or business unit that generates more cash than it consumes. Cash cows have a high market share but low growth prospects, but low overhead helps them reliably provide cash flow to fund research and development, cover administrative costs, pay dividends to shareholders, and more.
What do you do with the cash cows? Milk them! Invest as little as possible in their bovine goodness while continuing to reap all the beefy benefits they provide. (No livestock was harmed in the making of this matrix)
Stars: Stars have a high relative market share in a market that’s growing quickly. burning a significant amount of cash investment, they generate correspondingly large cash flows.
What to do with stars? Feed them, boost their growth, and maintain their competitive advantage in the market. Stars are priorities in your product portfolio. If you focus on them, as the market matures, stars can come down to earth to become cash cows.
Question marks: Products with a low market share in a quickly growing market are question marks. Question marks require significant investment to increase their market share. While you’d like them to become stars, if question marks don’t become a market leader and market growth declines, they’ll inevitably end up becoming dogs.
Dogs: No offense to man’s best friend. These products have a low market share in a slowly growing marketplace. You could keep them in the doghouse, as they generally provide some cash flow and can sustain themselves on some basic level. Usually, however, dogs are simply phased out (insert “Old Yeller” reference here).
When to use a BCG Matrix
So, who should use the BCG Matrix and when should they do so? You should use it whenever you need a high-level view of the opportunities for each product in your portfolio, a strategy for allocating limited resources so that long-term profit is maximized, or just a way to know if your portfolio is sufficiently balanced.
For more information on how draw.io can help find the answers you need, check out our BCG Matrix video, visit our YouTube Channel, or book a free demo to learn more about the limitless possibilities of draw.io!
Last Updated on October 20, 2022 by Admin

