This blog is part of our I 🧡 draw.io series, where developers worldwide tell us why they love draw.io. Follow us on social media to learn how others use draw.io.
Diagrams, charts and other visuals are key to any presentation, and draw.io is a powerful tool for creating diagrams. One of our users, Vinh Nguyen, described it as, “Very useful and time saving app. I usually use it for designing games, for presentations, and brainstorming sometimes. It helps visualize things effectively.” But often the diagrams we create for our internal purposes are too complex to be useful in a PowerPoint or Keynote – too much information, an unintuitive design, and a choice of colors that would make the marketing team sigh.
The good news is that you don’t have to create audience-friendly diagrams from scratch. With a few simple tweaks, your diagram will be ready for the spotlight.
(Want to skip right to trying the app? Get started with draw.io on the Atlassian Marketplace.)
Choosing the right format
Exporting your draw.io diagram and inserting it into your favourite presentation program is as simple as File > Export as.
You can save your diagram as either a raster image (.png, .jpeg) or vector (.svg). Raster images are built from pixels and are great for accurate colour and detail and will work with any presentation software. Vector images on the other hand, are based on mathematical equations, which means they can be resized without losing quality. Some programs like Keynote are unable to import .svg files.
There is one more reason to use a .svg file if you are building your presentation in PowerPoint. With just a few clicks you can edit your diagram within PowerPoint itself:
- Insert your .svg image.
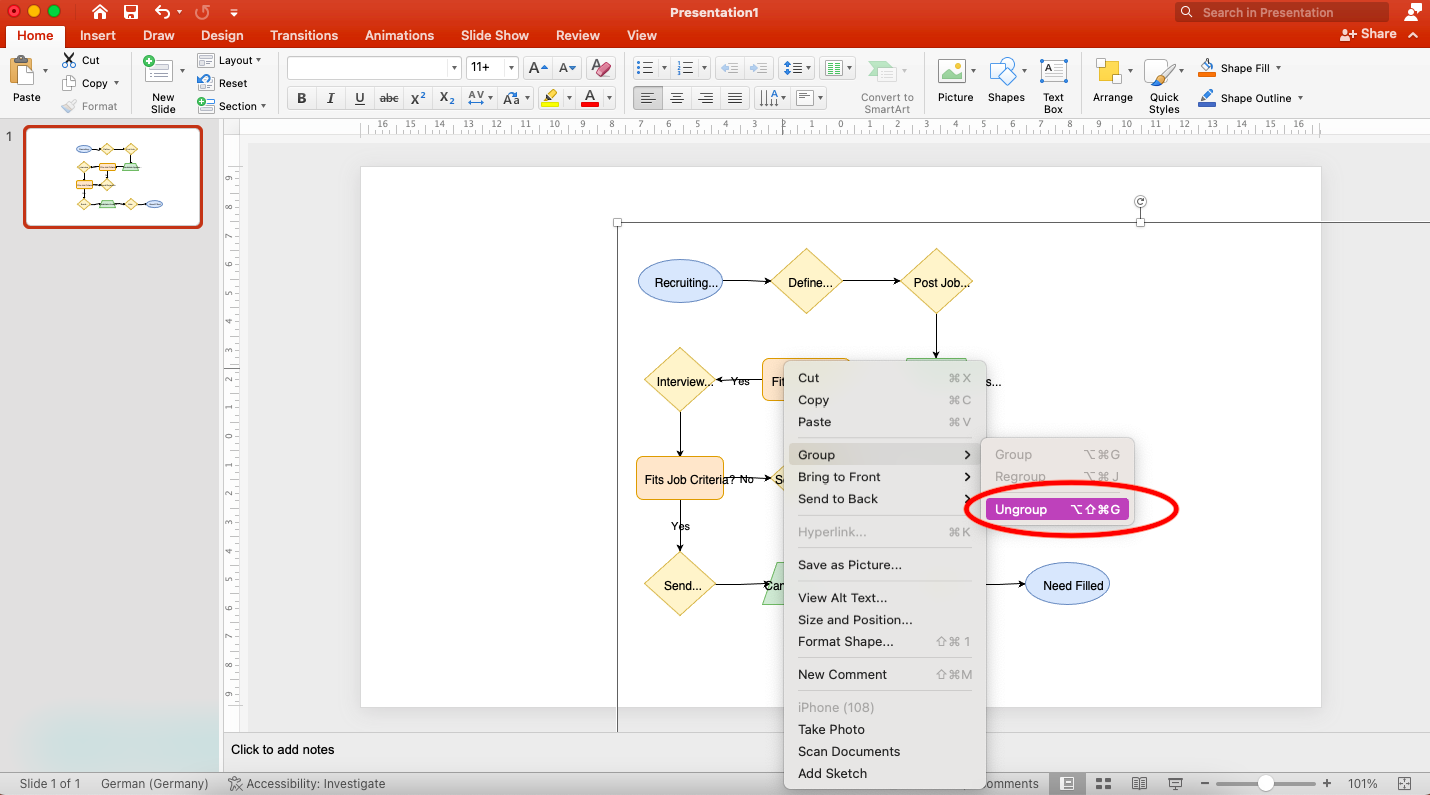
- Select Convert to Shape from the right-click menu.
- Right click again, hover over Group and select Ungroup.
Done! Now the elements of your diagram will be transformed into separate shapes that you can move, resize and recolor as you would any other shape in PowerPoint. This is a great option if you need to make further changes to your diagram as your presentation comes together.
Use layers to break down complex diagrams
When it comes to presentation slides, less is more. Your audience needs to quickly understand the information in front of them, and you don’t want them interpreting a complex diagram when they should be listening to you speak. In general, its best to keep it simple and remove any information that does not support your story.
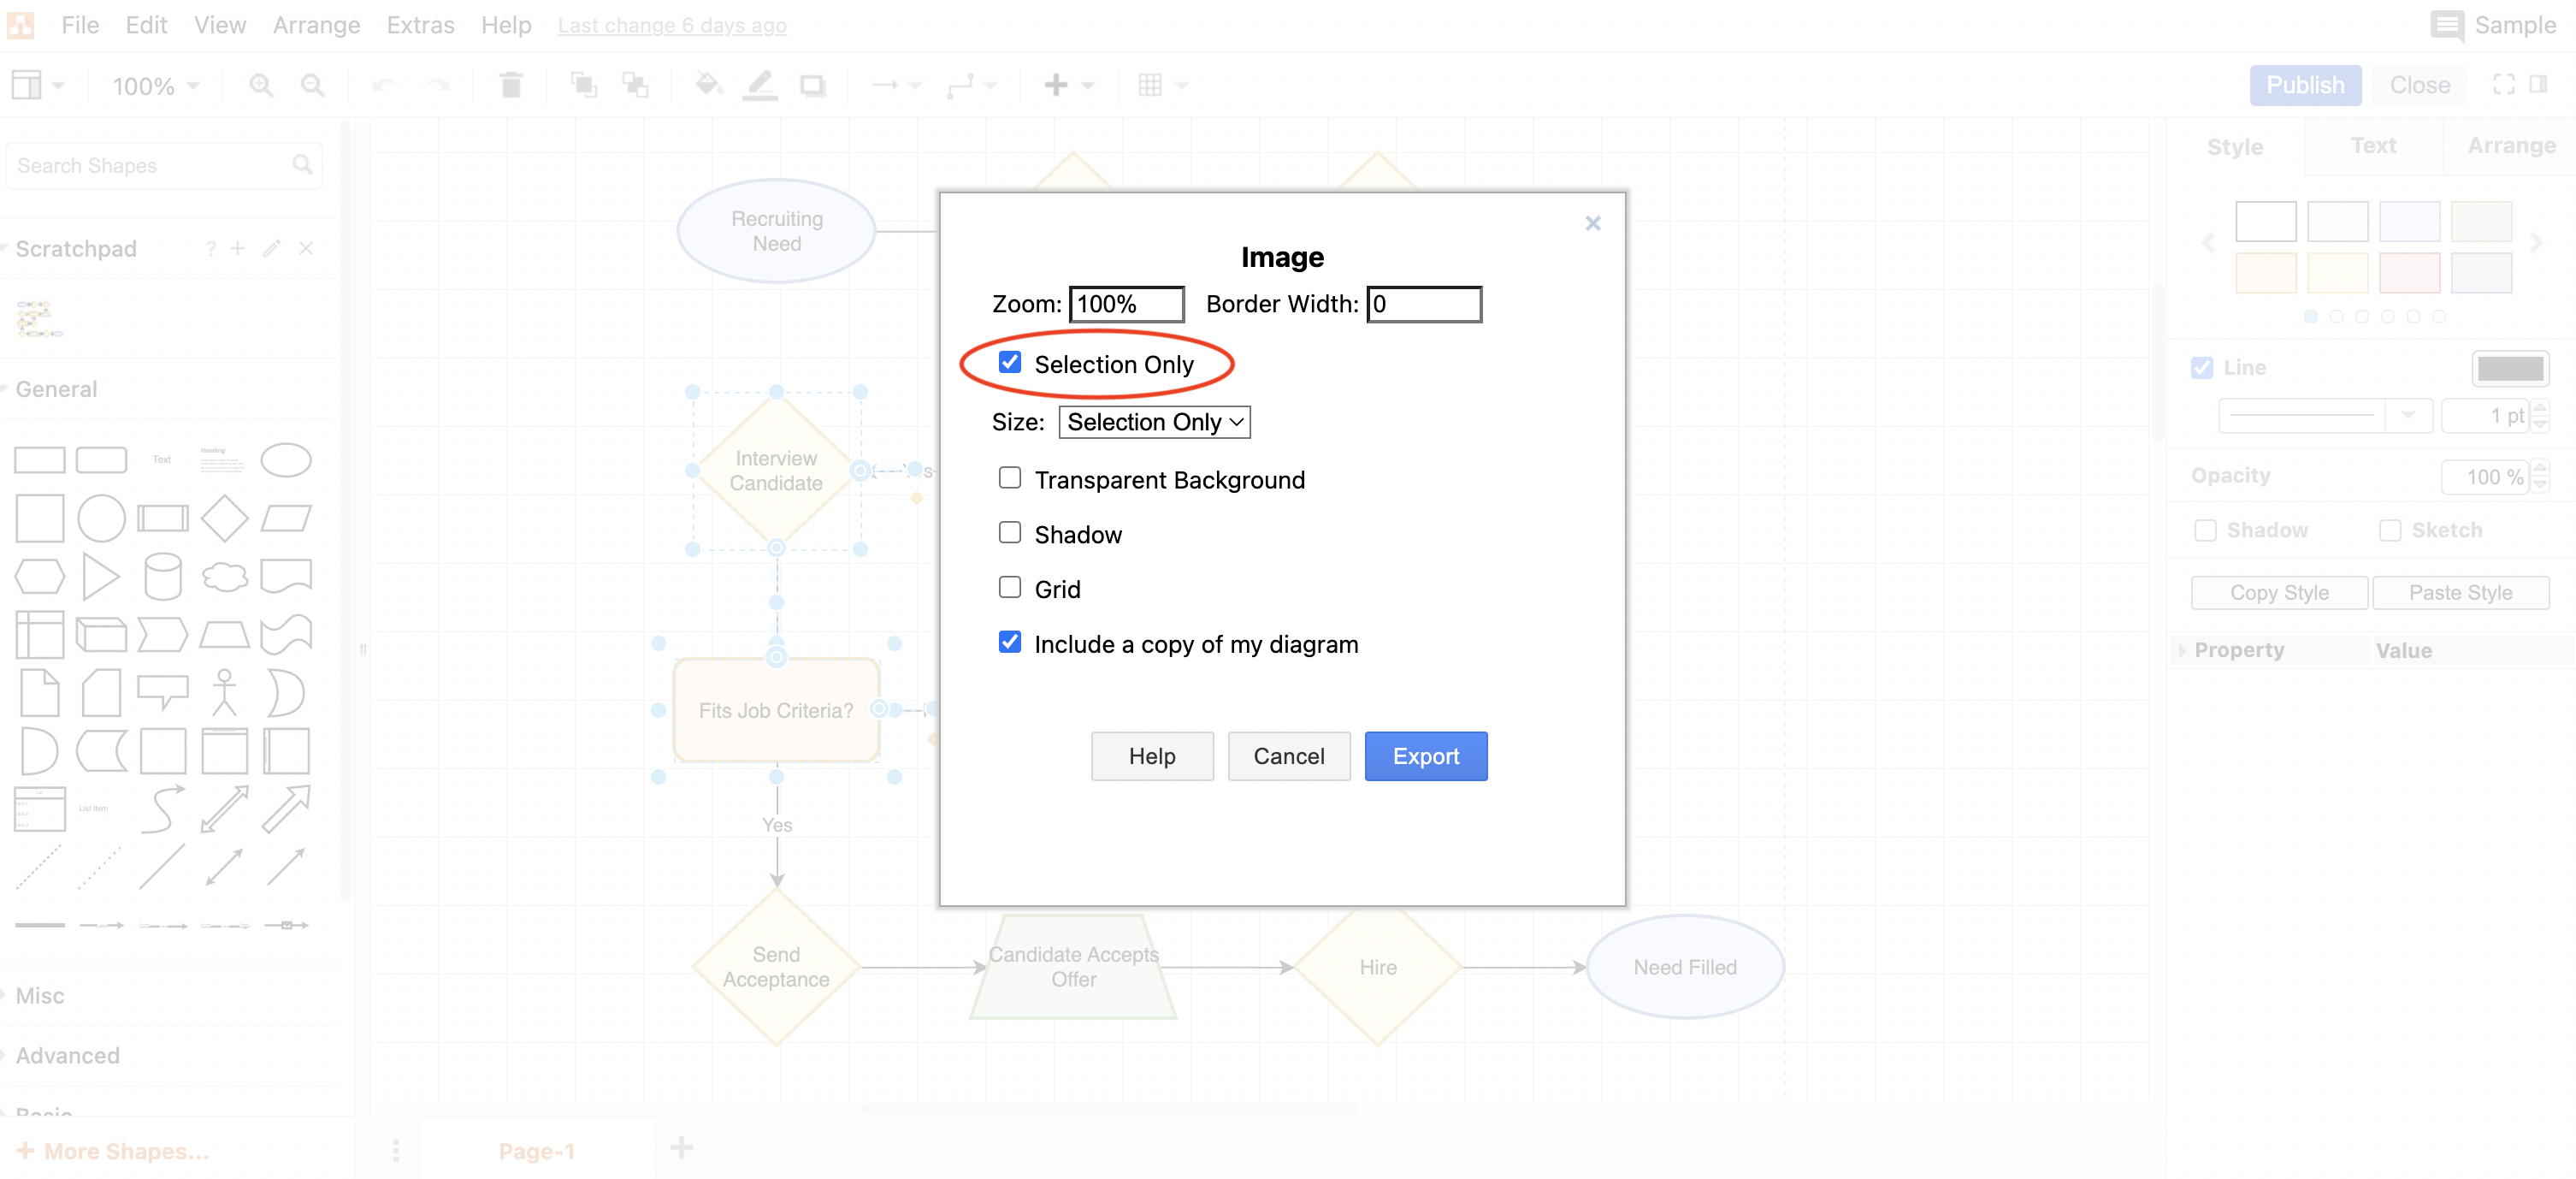
Luckily, draw.io makes it easy to choose which parts of a diagram to export. Simply select the elements you want in your slide, then click File > Export as and choose .png, then check off Selected only. If you organize your diagrams by layers, this will be a cinch.
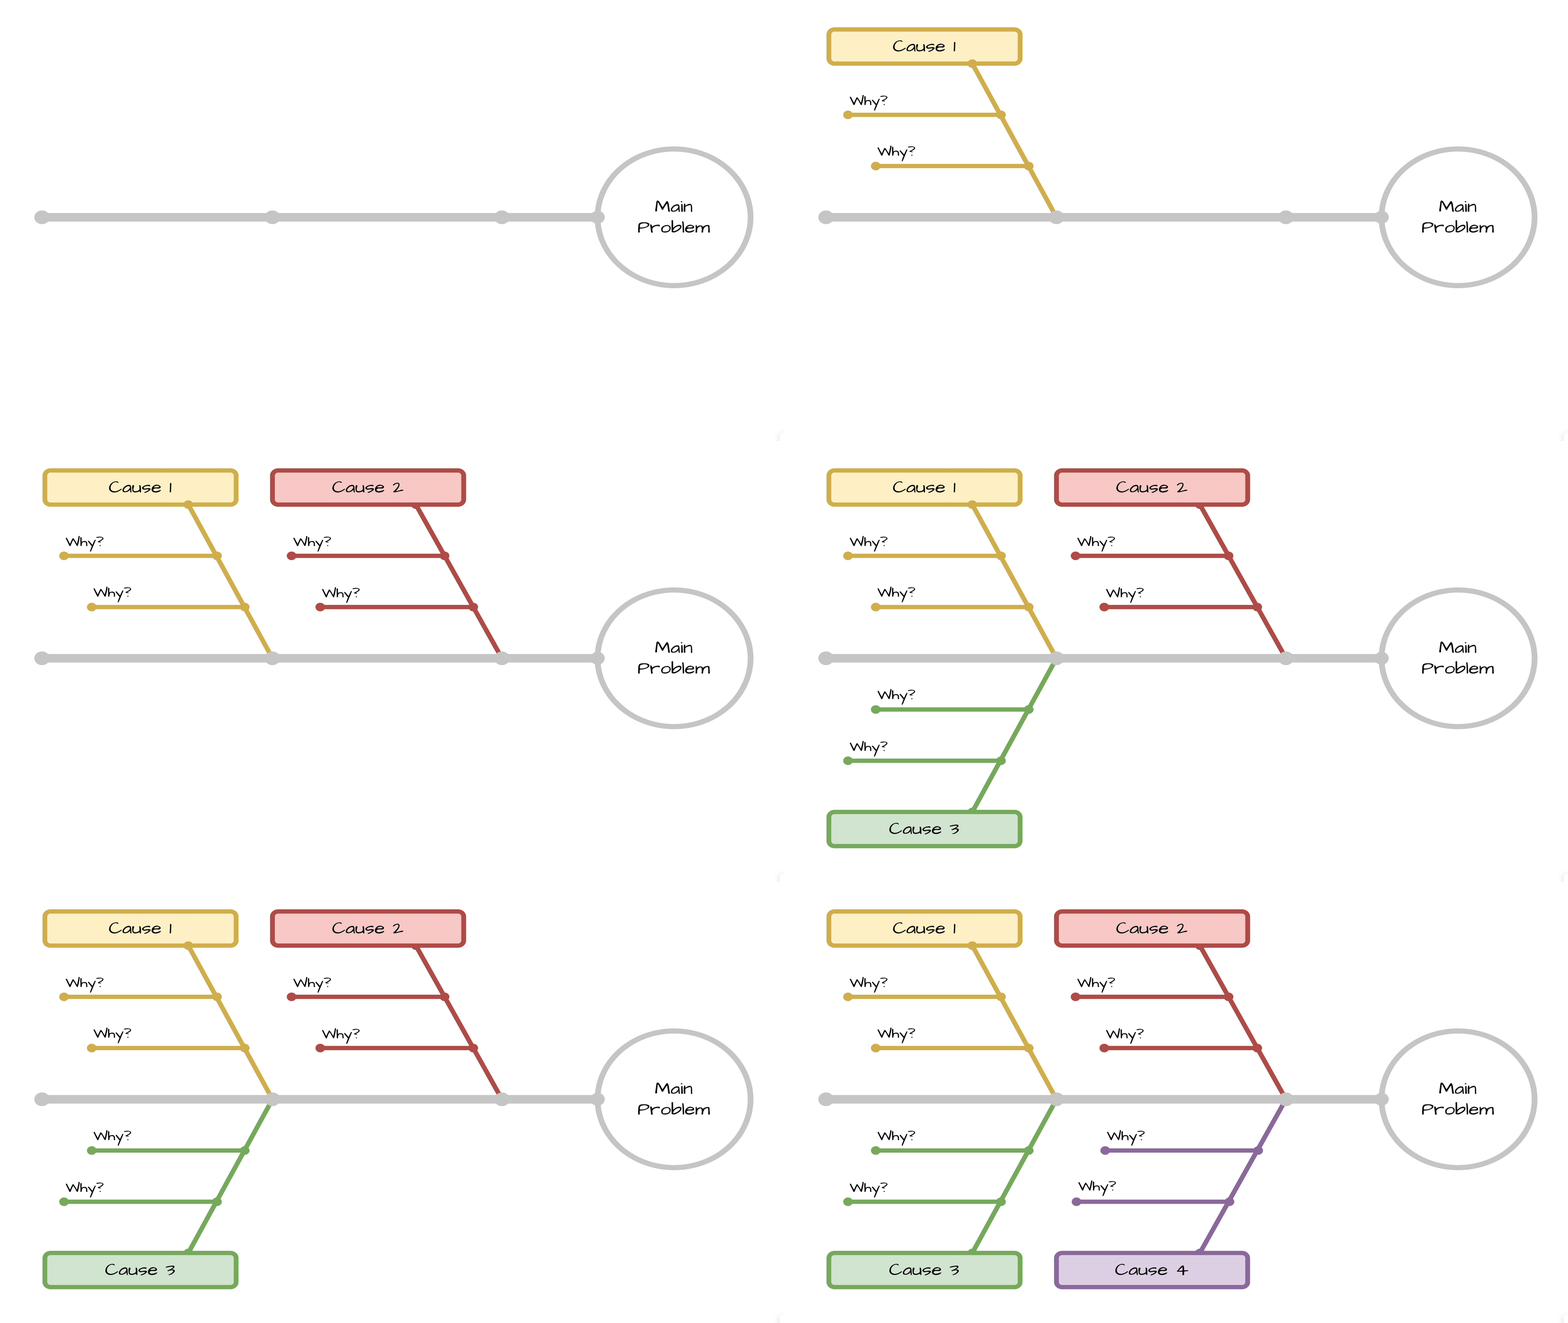
You can use multiple slides to build up complex diagrams in front of the audience, layer by layer. For example, if you are presenting a fishbone diagram, you may want to start with just the main problem and causes, and in subsequent slides include the details of each cause. This makes it easier for the speaker to tell a story and guide the audience through the information in a structured way.
Give your diagram a makeover
The right colours and font will make it easier for your audience to quickly understand the information in front of them. It’s simple to select multiple elements in draw.io and change their design as a group, especially if you work with layers. Use a single color to represent the same type of information, and choose colors with good contrast and clear, well-sized fonts.
You can also customize your colours and font to match your company’s look and feel, and even use custom shapes based on your logo and branding. But remember, less is more, so be sure to limit the number of shapes, colors and fonts.
You are currently viewing a placeholder content from Youtube. To access the actual content, click the button below. Please note that doing so will share data with third-party providers.
More InformationFinally, if you need to make new diagrams for your presentation, there are several templates in draw.io that are a perfect fit, including lifecycle and timeline diagrams, not to mention symbols for any industry or use case. Whether you’re using an existing diagram or creating something, consider draw.io your one-stop-shop for presentation visuals.
Have you used draw.io diagrams in a presentation? We would love to hear about it! Reach out to us on our social channels.
You don’t use draw.io yet? Convince yourself and start your free 30-day evaluation today. Or book a free no-obligation demo with our customer success team to learn more about how draw.io can make life easier and more productive for you and everyone in (and outside of) your company!
Happy diagramming!
Last Updated on April 26, 2023 by Admin

