Gitflow diagrams can be a valuable tool for coordinating development efforts and ensuring that code is properly organized and maintained. Additionally, they can be used as a reference for new team members to quickly understand the branching model used in a project.
If your team uses Confluence, draw.io’s whiteboard editor offers an easy way to design your Gitflow diagram right in your project page. Read on to learn more, or visit the Atlassian Marketplace to try the app.
draw.io’s whiteboard editor
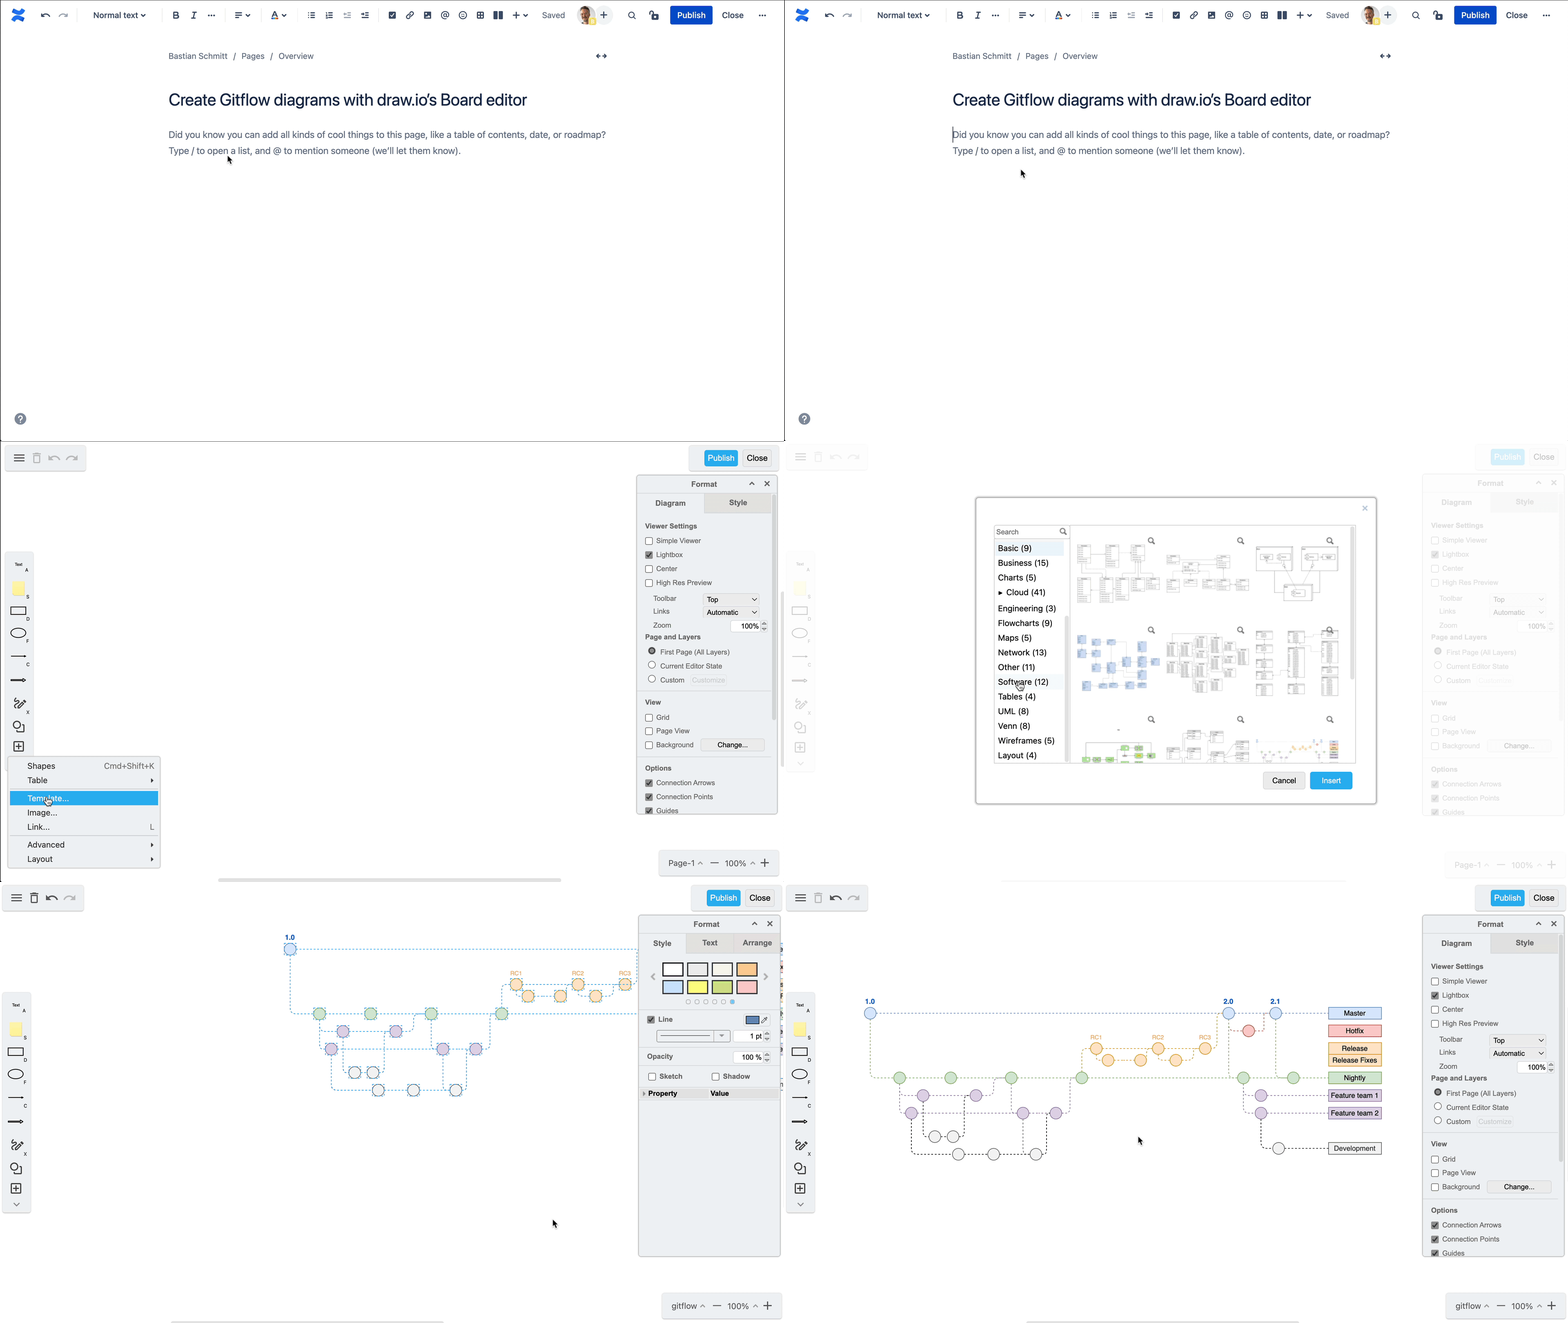
draw.io’s whiteboard macro uses our intuitive drag-and-drop diagram builder, with a simplified editor so you have more space to sketch out your ideas. With draw.io installed, open your Confluence page and insert the draw.io Board macro to get started.
Working with a template
While you may find it helpful to build your own Gitflow diagram from scratch, you can also start out with a pre-built template. To access draw.io’s Gitflow template, click on the boxed plus sign in the left-hand menu, and then select Template…
In the template library, choose the Software category and scroll down until your find the Gitflow template, then press Insert. With the diagram inserted you can now add or remove nodes, edit the labels and make it your own.
If you prefer to build your own Gitflow diagram from square one, the process can be just as fast as modifying the template.
Creating your master branch
In a Gitflow diagram, the master branch is the main branch where the official release history is recorded. Start your branch by adding a circle shape to the board – you can click and drag it from the shapes panel, or simply press the F key. Each circle in this branch will represent a different production release of your project.
You can resize and stretch the circle with the handles of the bounding box, and modify the color and line style from the format menu on the right. Once you are happy with the look of your circle, click the Set as Default Style option in the format menu. This will apply the same styling to any other shapes you add to the board. Finally, double click on the circle to label it with the version number.
To add your next production release node, click on the first circle, and select the arrows outside the bounding box. You can either click and drag to create an arrow ending in another circle, or click the arrow and select the shape you want, in this case a circle.
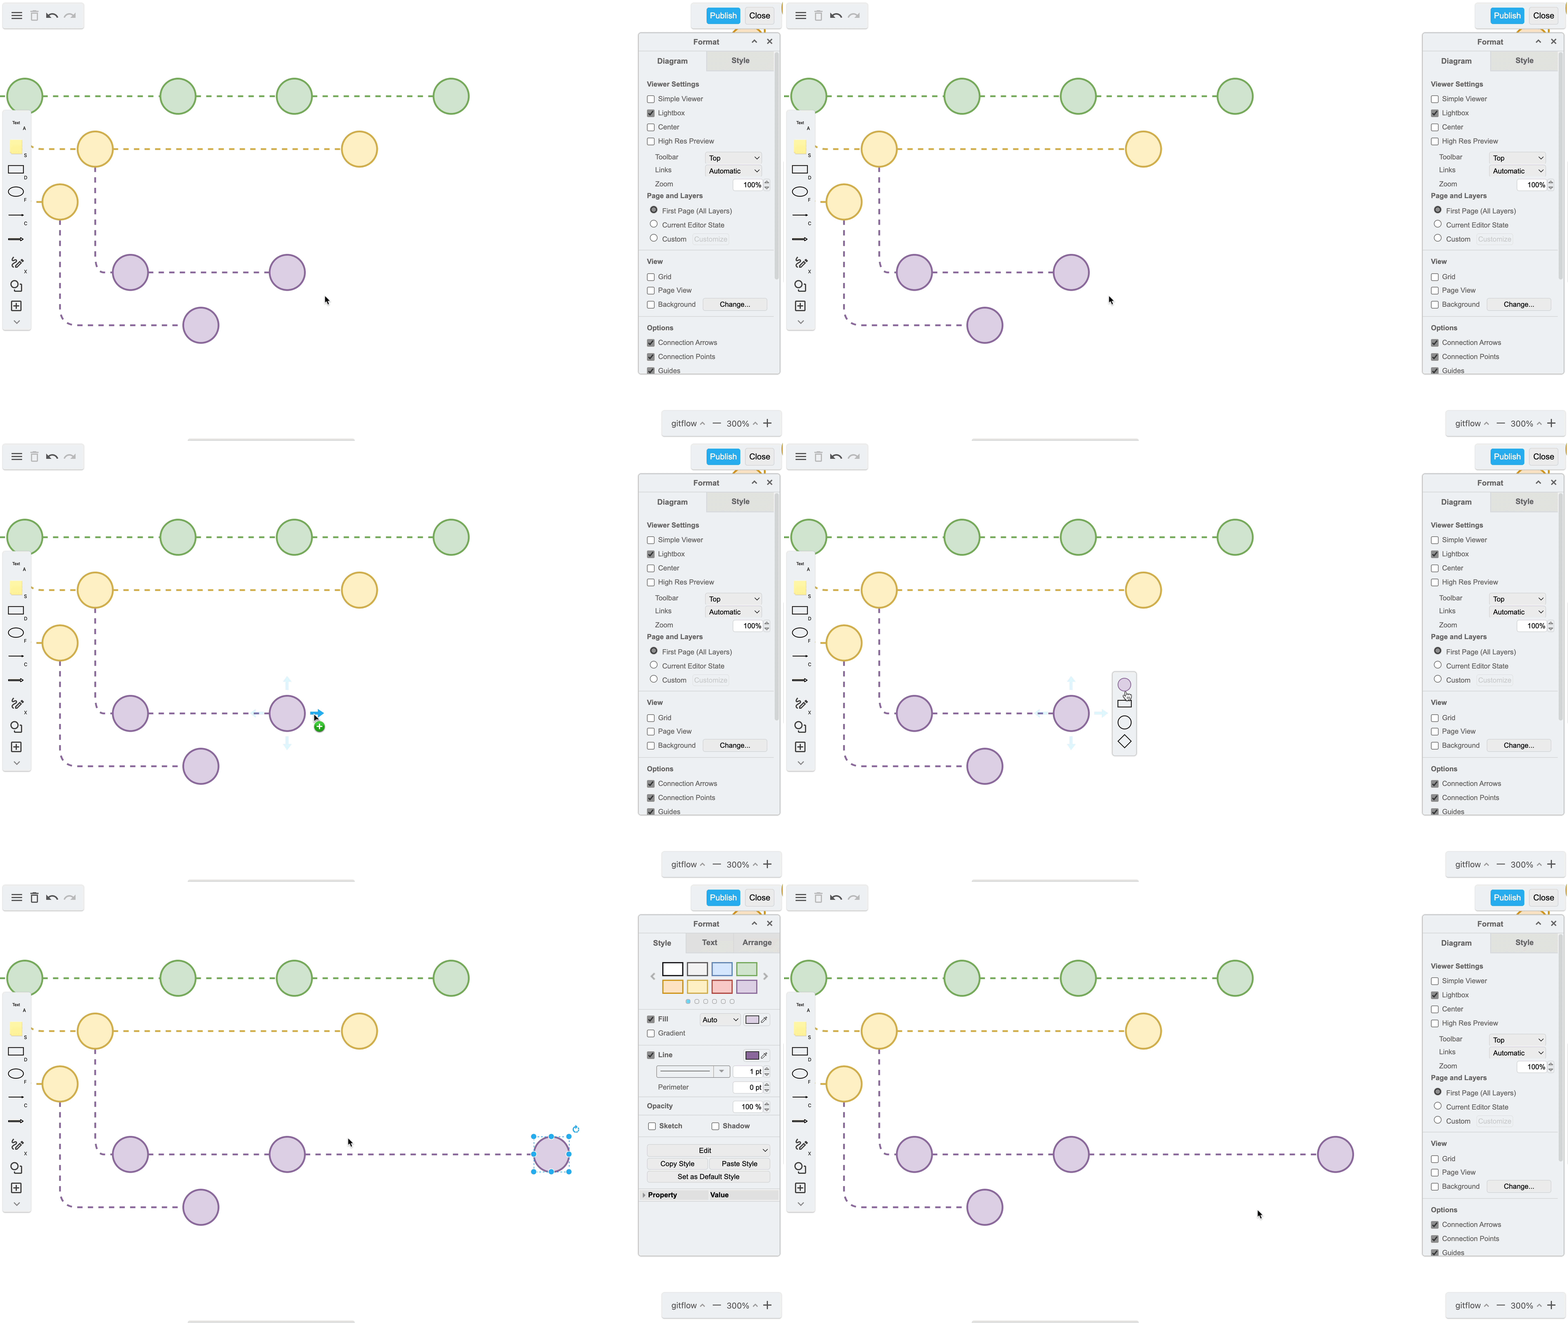
Just like the circles, you can also style the lines between nodes, changing their color and stroke, and the formatting will be automatically applied to the next line you create.
You can repeat this process for as many version numbers as you need, updating the labels as you go. Finally, if you want to add a legend to your diagram, you can finish your main branch by selecting a square shape instead of a circle and labelling it “Master Branch”.
Add your project, feature and development branches
Depending on the scope of your diagram, your next branch could represent a project, a feature, or the development of pre-production code.
To create your second branch, copy and paste one of the circles from the master branch and then change the color, remembering to Set as Default Style. Once again use the blue arrows to clone as many nodes as you need for this branch, and finish with a square shape to label the branch.
Alternatively, you can simply copy and paste the entire first branch, and with all your nodes selected, change their color. If you need to change the spacing between nodes, just click and drag them into position and the lines will automatically adjust. Add any extra nodes, and then finish by updating your labels.
Repeat the process to create branches for features, hotfixes and whatever other supporting branches are required.
Connect the branches
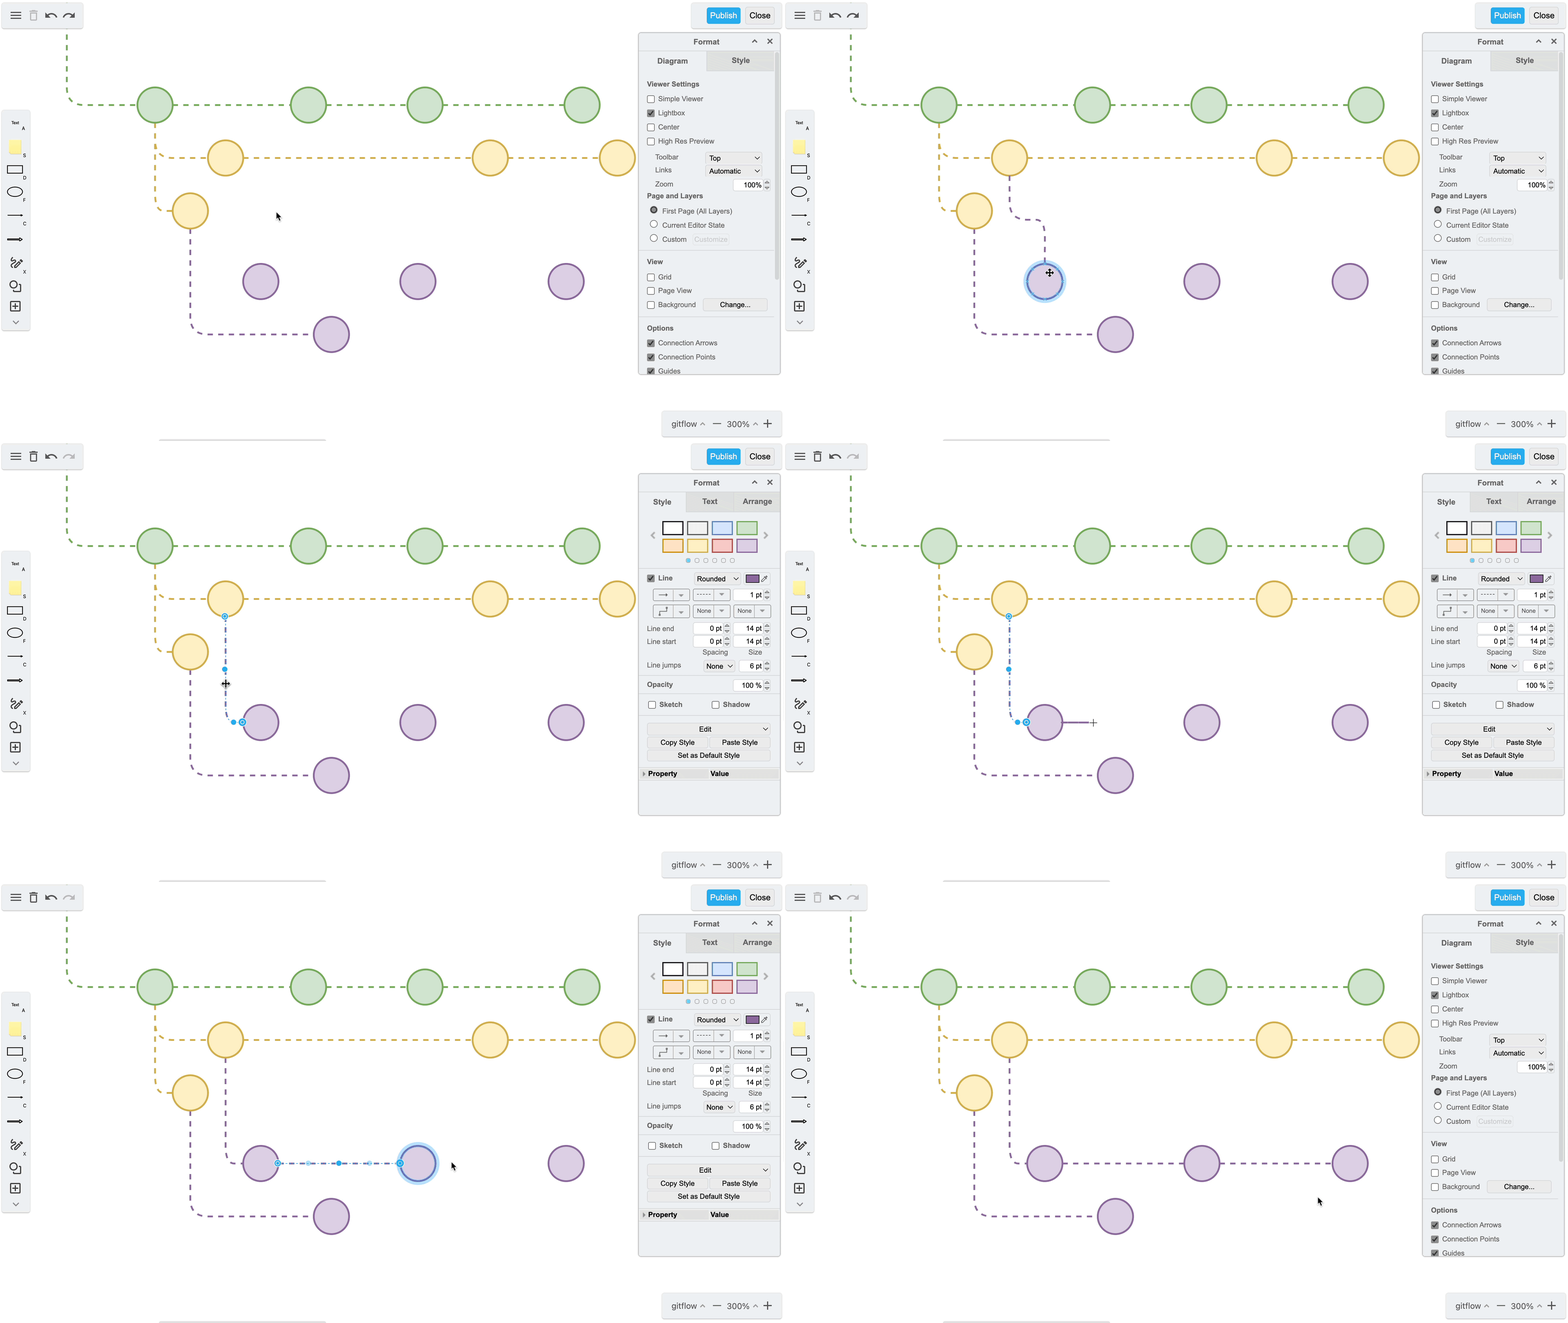
In a Gitflow diagram, the connections between branches represent the flow of changes between them, indicating which changes have been merged or integrated into which branches. These connections help to visualize the relationship between different branches, and can help your team understand the overall evolution of the codebase.
To connect the branches in your diagram, hover your cursor over a circle and select one of the anchor points around its edge. Click and drag from there to the destination circle. You can style the connecting line, and you can also change the curve of the line by clicking on it and dragging the blue anchor point.
Using libraries
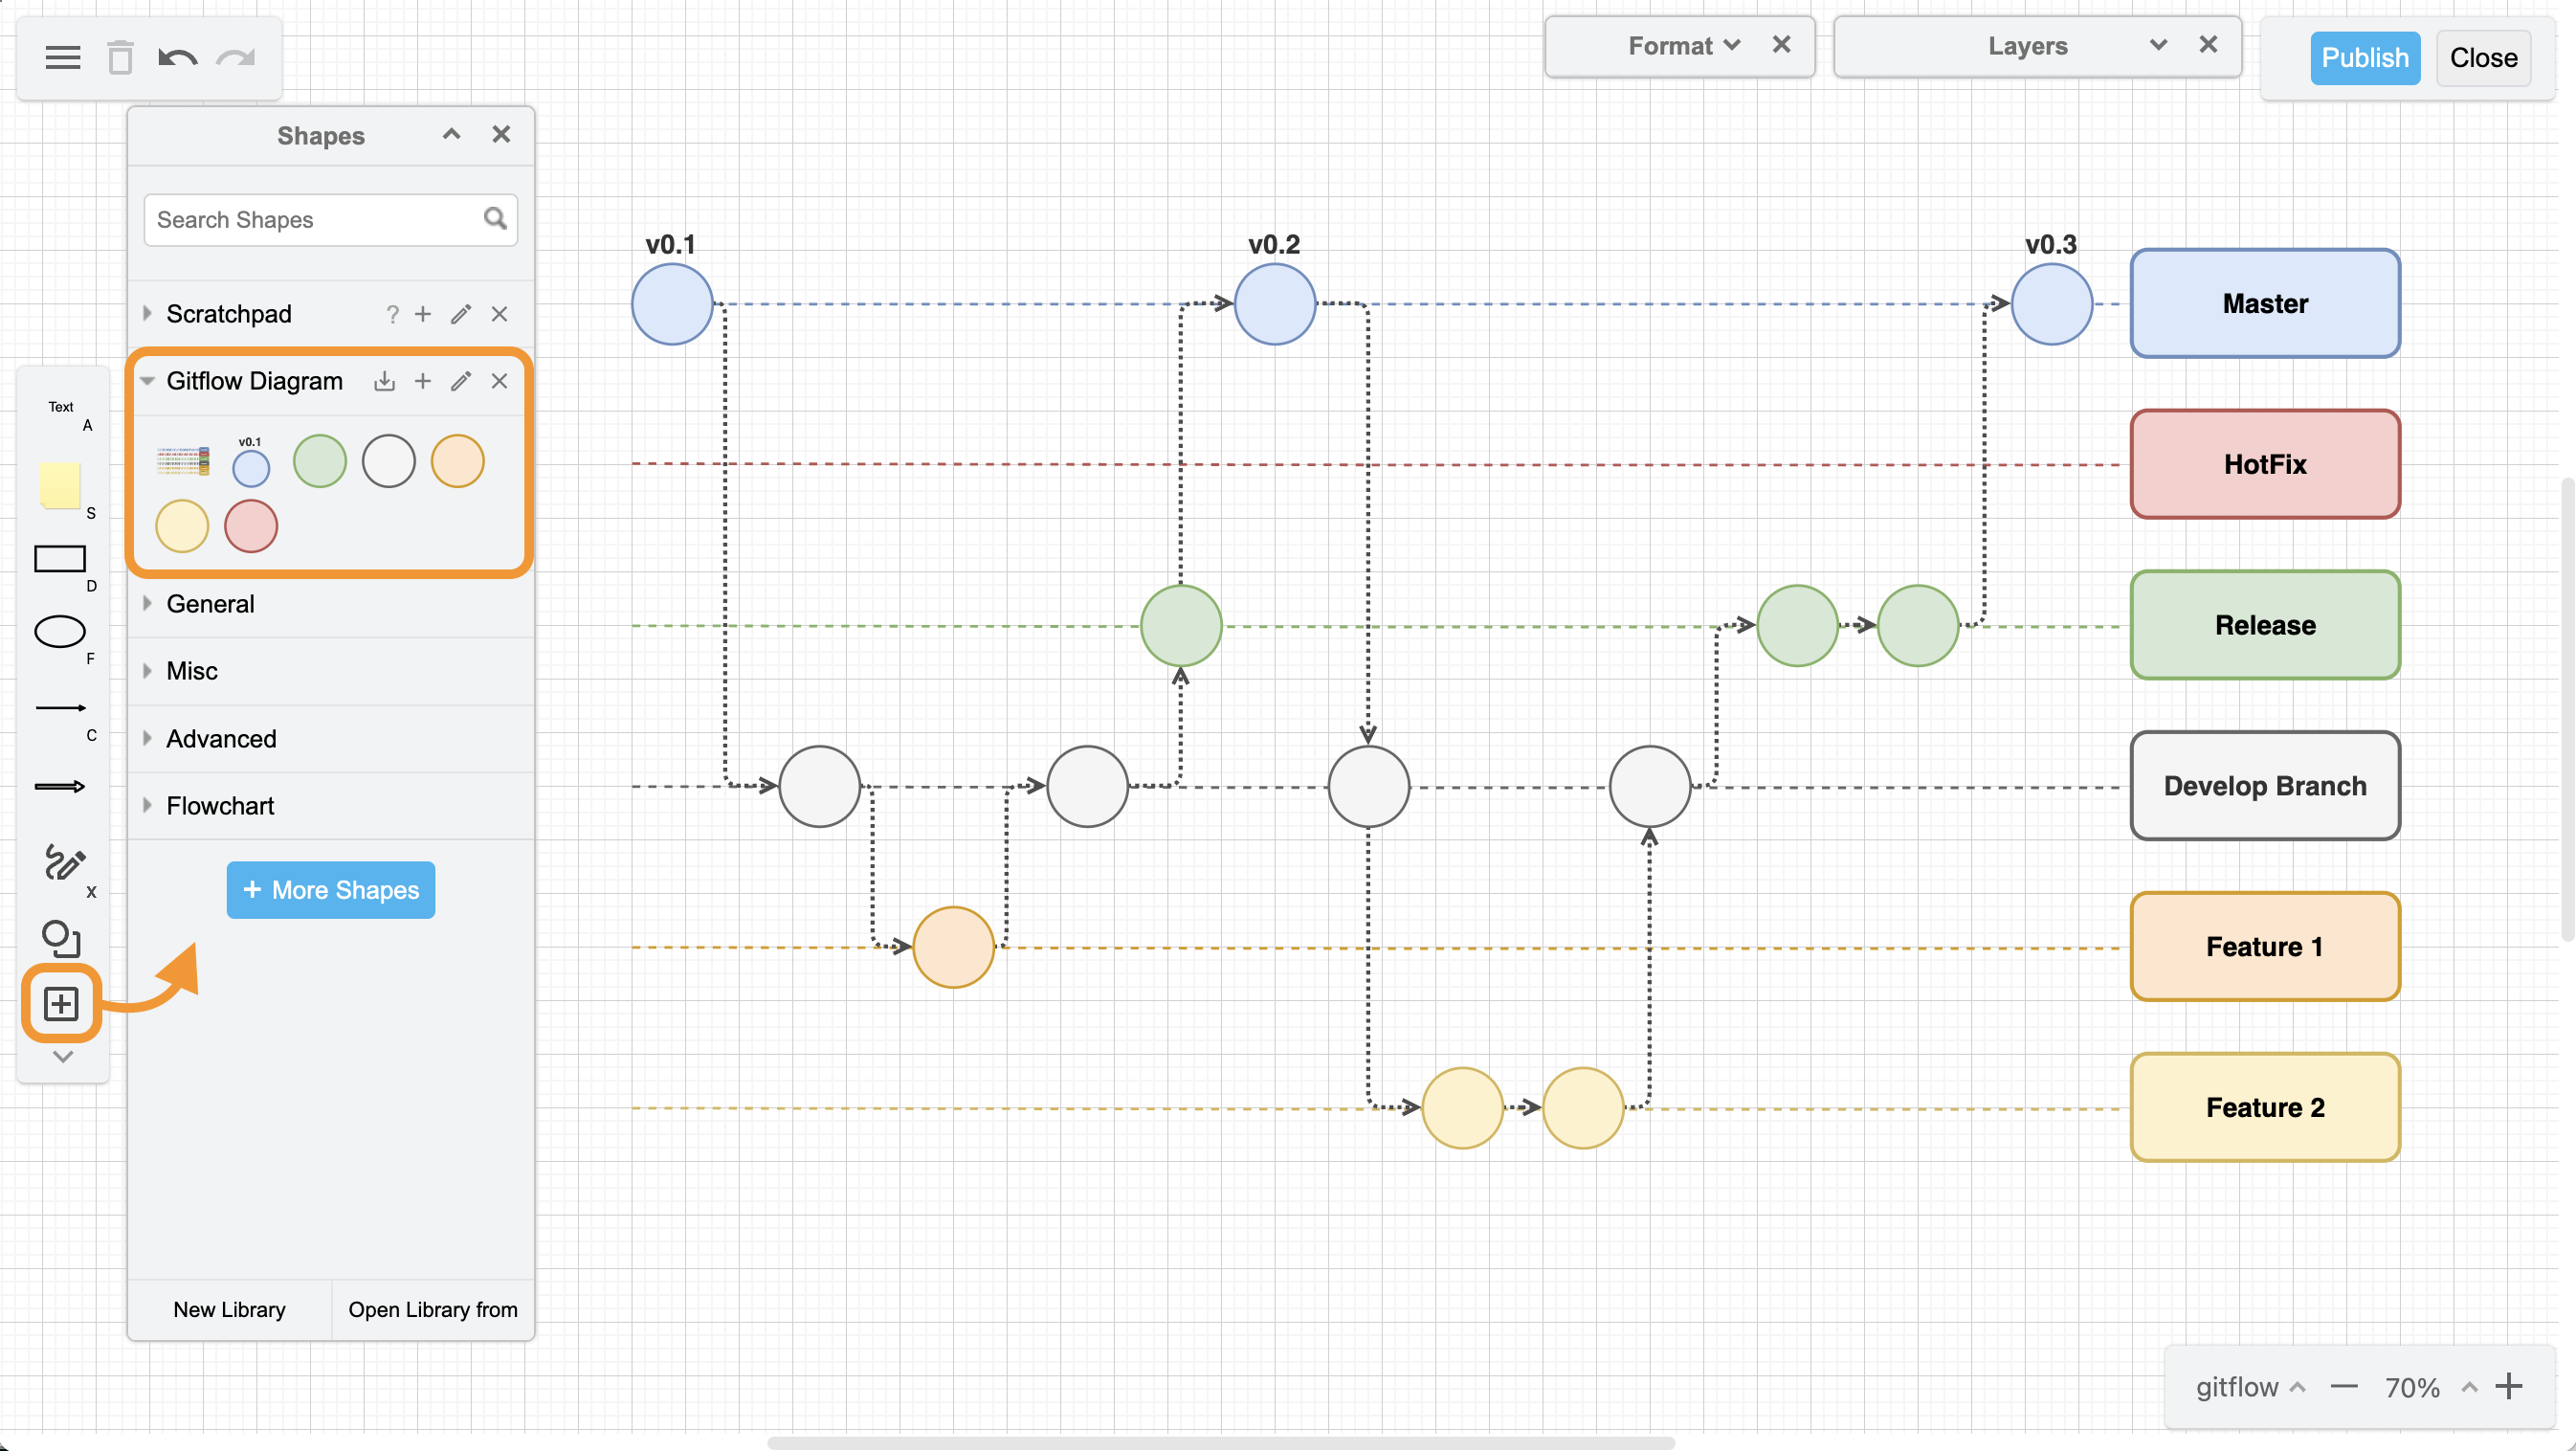
draw.io’s board editor is designed with a streamlined set of shapes and tools, but there are plenty of other icons and images available if you need them. In the left-hand menu, click the plus sign and then Shapes to open the larger library. You can use the search bar to find the specific shape you want, search by use case, and even upload your own images.
With a clear and concise diagram, you and your team can gain a deeper understanding of your codebase, and more effectively manage and collaborate your projects, all within Confluence. Visit the Atlassian Marketplace to find out more about draw.io and get started.
Do you like to dive deeper into the world of draw.io? Access our linktr.ee page to follow us on Social media and learn how others use draw.io and hopefully pick up some tips and tricks.
You don’t use draw.io yet? Convince yourself and start your free 30-day evaluation today. Or book a free no-obligation demo with our customer success team to learn more about how draw.io can make life easier and more productive for you and everyone in (and outside of) your company!
Happy diagramming!
Last Updated on December 22, 2022 by Admin

