Flowcharts, process diagrams, workflows, activity diagrams: No matter what they are called, they all visualize the steps, decisions and sometimes the interactions needed to get something done. There are many different types of flowcharts, and you can create them all using draw.io!
Flowcharts in the draw.io template library
When you create a new diagram in draw.io, select Flowcharts from the list on the left of the template library dialog. Alternatively, click Arrange > Insert > Template to open the template library from the draw.io editor.
There are a number of different flowchart templates you can choose from. Hover over one to see its name (use case) if it is not written under the template diagram in your version of draw.io.
As a Confluence administrator, you can add your own custom flowchart templates and make it faster for your colleagues to diagram following your company’s style guide. See how to customize the draw.io interface in Confluence.

Why document your processes?
We’ve all had it happen, suddenly a colleague who is responsible for one particular set of tasks leaves, and no one knows what to do to take over their responsibilities because nothing was documented. Or, you get to a new company and no one wants to take the time away from their work to train you to do your job. It’s a horrible feeling when you have no idea what steps you need to do to get something done, and done the right way, without stepping on any toes!
It’s bad for the company too – how much time and productivity is lost trying to onboard new hires and team members without any form of documentation?
Flowcharts are useful because they minimize employee stress, are very easy to understand and therefore reduce errors, plus they save time and money.
- Onboard new employees and team members faster.
- Minimize cross-team misunderstandings about workflows and areas of responsibilities.
- Document processes and how they change over time for accreditation audits (SOX, ISO).
- Manage customer expectations and uncertainty by explaining complaint and resolution processes in a clear diagram format.
- Communicate more clearly with an international audience.
Develop and store your flowcharts in Confluence with draw.io
Of course, your processes need to be developed and stored in a central knowledge base, and should be easily findable. Using draw.io diagrams within Confluence pages is ideal because your diagrams are versioned – all changes to the diagram are tracked in the Confluence page history. Plus, there are many other Atlassian Marketplace apps which record approvals of new processes or to changes made to existing processes, and you can control access to sensitive process diagrams with Confluence permissions.
Create many types of flowcharts with draw.io
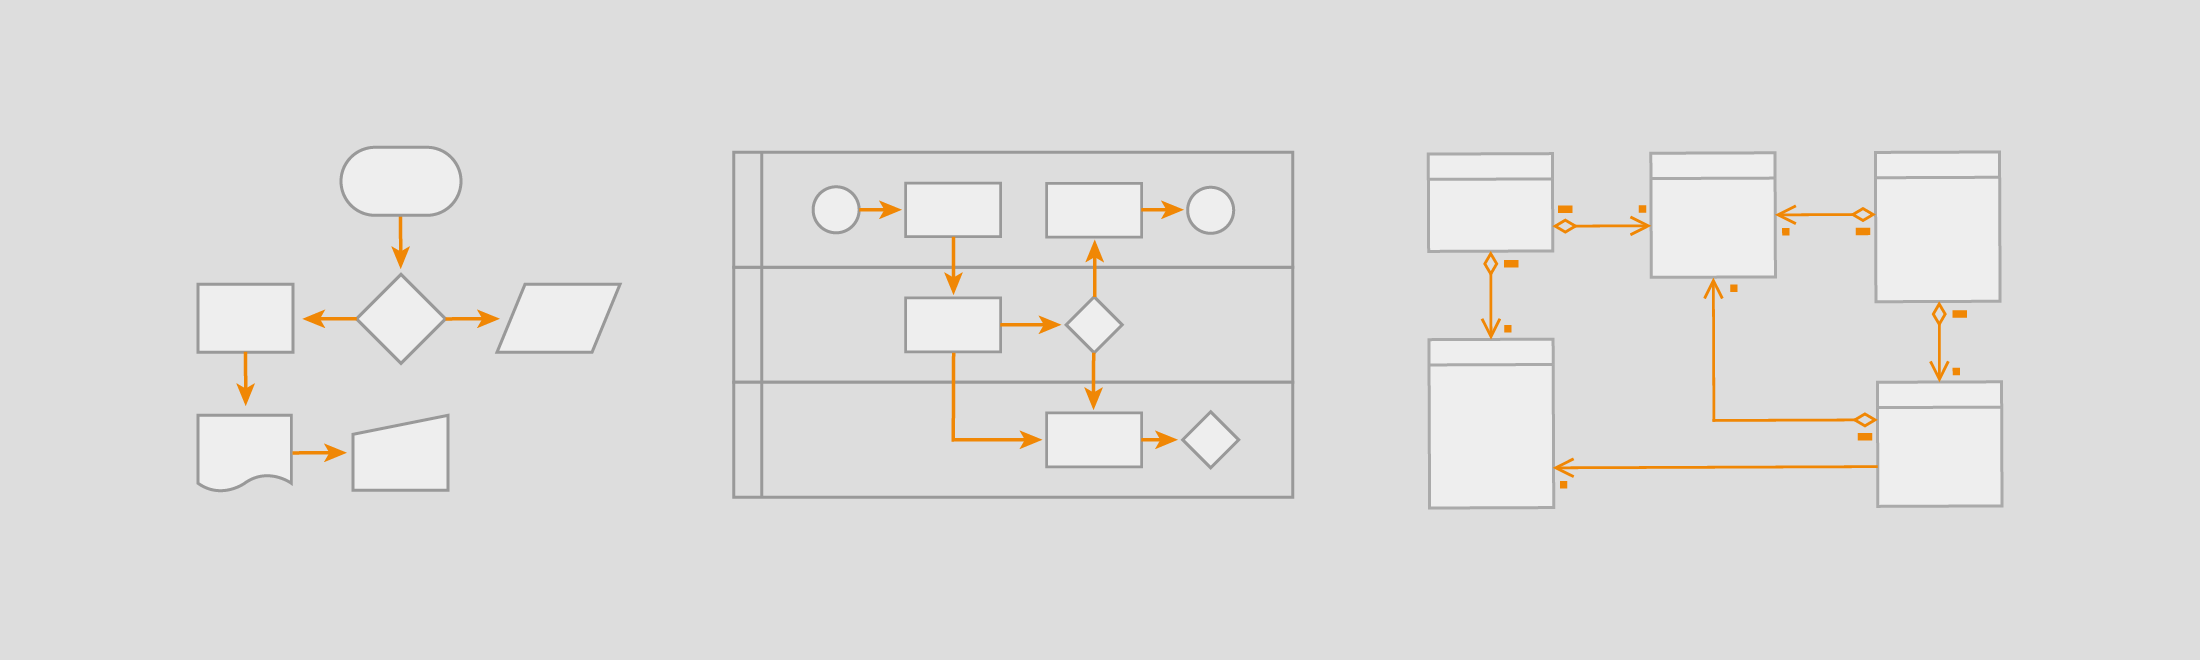
There are many different types of flowcharts, ranging from the simplest using just rectangles, circles and diamonds, through to the much more complex BPMN and UML activity diagrams. Let’s take a look at some of the more common types and their use cases.
Basic flowcharts
Rectangles for steps, diamonds for decisions and circles for the start and end points. You can’t get any simpler than that! Of course, you can add many other shapes for when documents are created, or for interactions with external parties, etc.
Multiple pages in the same diagram and links to them from shapes let you simplify your workflows even further by breaking down complex steps into “sub-flowcharts”.
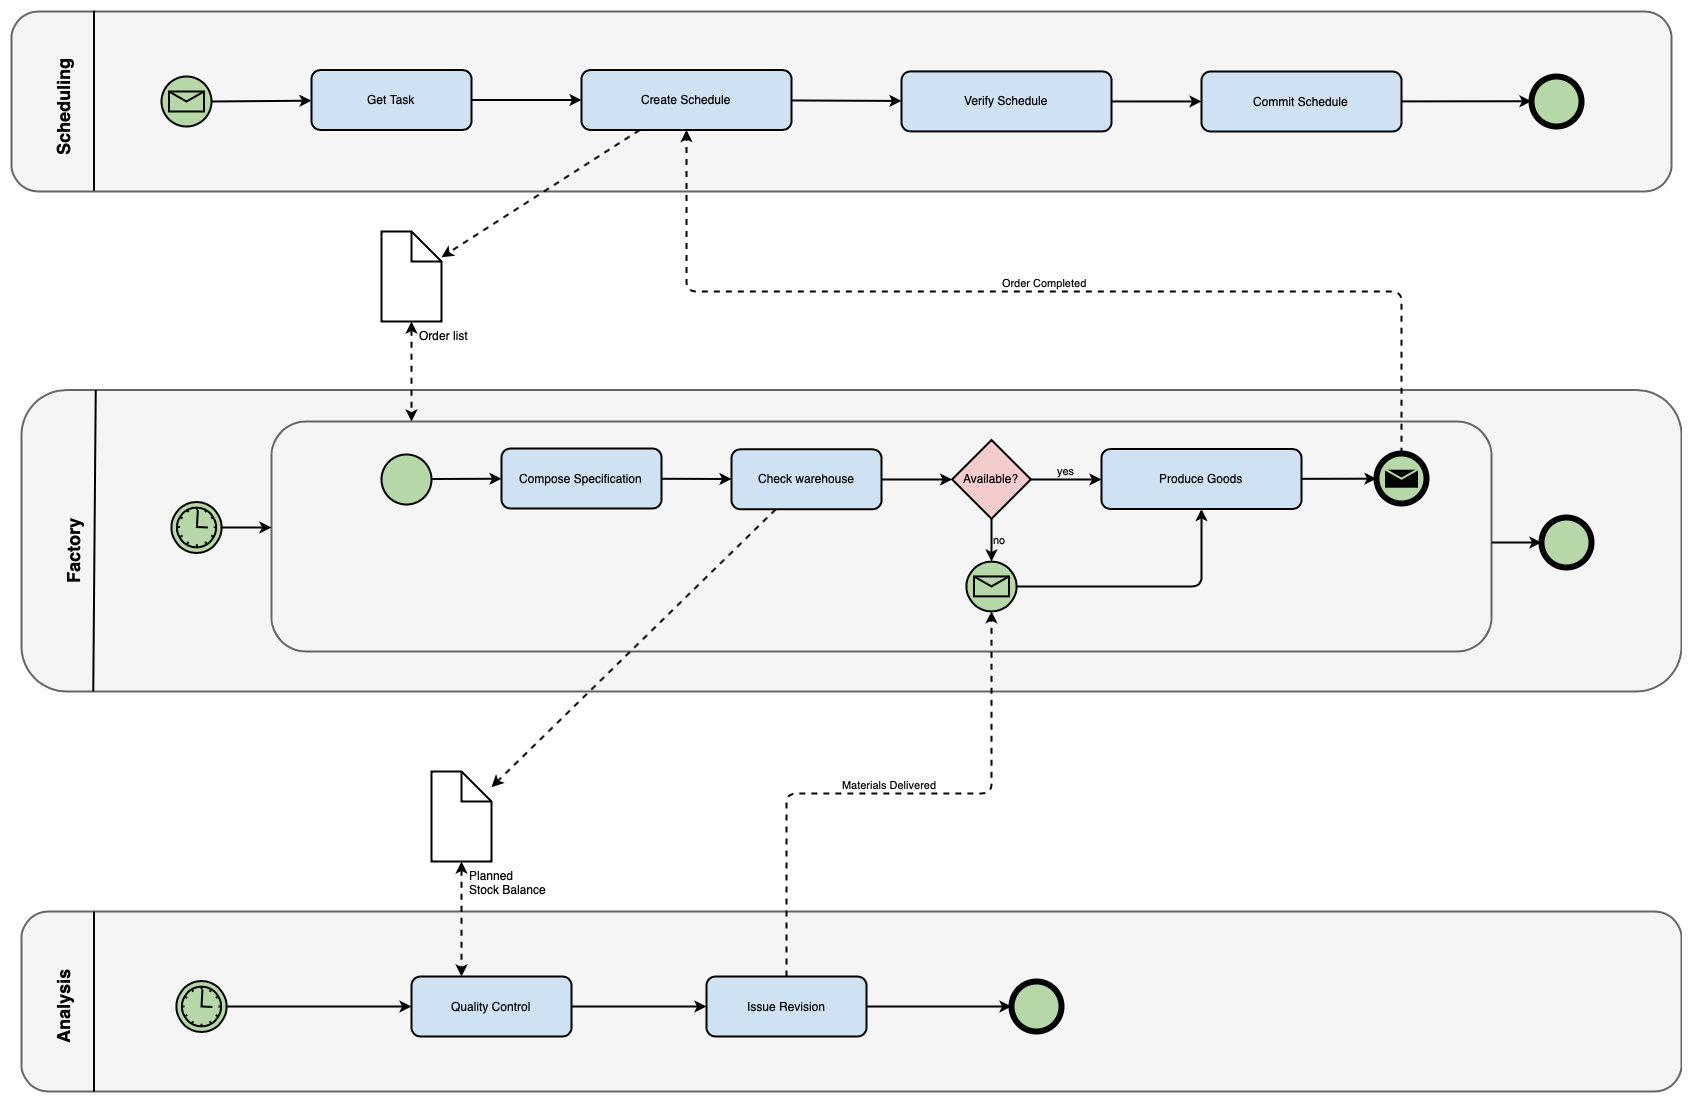
Swimlane diagrams
When you want to indicate when steps in a process are done by different teams, use swimlanes to indicate the various areas of responsibility. draw.io comes with a variety of swimlane template diagrams which you can either use as the foundation or simply inspiration for your own flowchart with swimlanes.
The swimlane container shapes are under Advanced shapes. If you don’t see this collection of shapes in the left panel, click More Shapes, make sure the General shape library is enabled, then click Apply.

BPMN diagrams
Business Process Model and Notation (BPMN) diagrams are a more specialized type of swimlane diagrams.
They use an expanded set of shapes (elements):
- different types of steps (emails written, documents created, approvals recorded, …);
- the variety of input and output ‘gateways’;
- events that happen, as opposed to the steps that must be completed;
- and three types of connectors are used to indicate the different types of flows – automated, message flow, and the actual sequence of a series of steps – as these can sometimes differ.
Click More Shapes in the left panel, scroll down and enable the BPMN shape library, then click Apply to see the various shapes used to build BPMN diagrams. You may also need the Advanced shape library and its container shapes for the swimlanes.
Data flow diagrams
More commonly used by software engineering teams, data flow diagrams track how data flows through a process or a system. Instead of focusing on the steps that people must perform and the decisions they must take, these diagrams simply visualize what happens to the data over its lifecycle.
While there are no control flows, decisions or loops, data flow diagrams do provide information about the inputs and outputs, and the process itself. Labels may be added to indicate what data is transferred between processes, data stores and states.
To create a data flow or context diagram, you’ll need to enable the shape library. Click on More Shapes at the bottom left, enable the Data Flow Diagram shape library in the Software section, and click Apply.
UML diagrams show many flows
UML diagrams, also commonly used in software development, show different types of workflows, data flows and procedural steps to visualize processes:
- Activity diagrams show the flow of control and decision points, very similar to the basic flow charts.
- Sequence diagrams are highly detailed and show the control flow in sequence and the data that is passed between steps.
You could argue that UML use case diagrams, state diagrams, interaction diagrams, and communication diagrams also fall under the umbrella of ‘flow diagrams’, as they all indicate some kind of flow of control and/or data. Learn more about the different types of UML diagrams.
You can input PlantUML to automatically create UML diagrams in draw.io. Click Arrange > Insert > PlantUML, enter the code in the text box, then click Insert. See how to use PlantUML in Confluence.

Last Updated on April 9, 2020 by Admin