Every company generates a wealth of vital information that must be beaten into submission on a regular basis. This information can include data outlining the structure of the company. It can encompass inventory and sales. It can encompass employees’ birthdays and what kind of cake they like. The point is: Information. Lots of it. It gets dumped into databases and then it must be made sense of.
In this third installment of our series on visualization in the insurance industry, we focus on the Entity Relationship Diagram (ERD) and how it – and draw.io – can help make sense of those seemingly hopelessly complex databases.
The basics
If you’re one of those IT types, you already know and work with entity relationship diagrams all the time. You can skip down below where we talk about how much easier draw.io can make life for you as you map out those databases.
For the rest of us who are just trying to get through our days with no projects blowing up in our faces ERDs may be as mysterious as, well… databases. So, let’s get everyone up to speed as to exactly what ERDs are and what they can do for you.
The database
It all starts with the database. All that information we mentioned above, it’s got to go somewhere. And the way in which we store it has to make it all work together so it can give us the answers we need when we need them and keep the right orders going to the right customers at the right addresses, etc, etc… Put as simply as possible, a database is a structured set of information that’s organized to make data easily updated, managed, and retrieved.
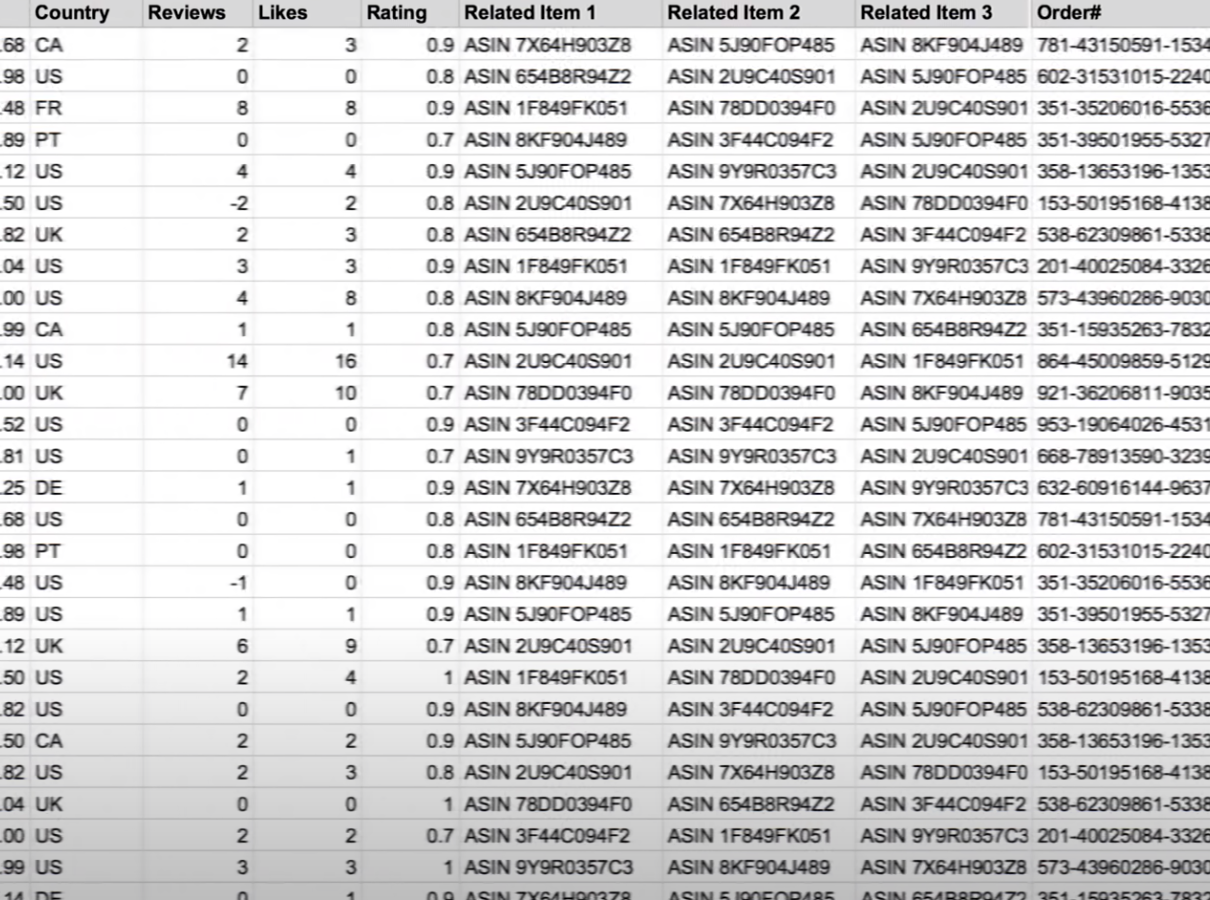
When we think of databases, we usually picture something like this:

But, unless you’re some sort of savant, you can’t just look at something like this and get any real picture of how all of the various bits and bobs of information interconnect and work together. So, what do you do?
Well, you know what they say about pictures and a thousand words? We say that’s an understatement. In fact, visualization can help make sense of many thousands of words (and numbers), especially when that visualization is an entity relationship diagram.
Entities and attributes
Stripped down to the basics, your database contains anywhere from a small boatload to a luxury cruise liner’s worth of what we like to call Entities and Attributes. Let’s start with entities. In the insurance industry, Entities might include customers, policies, or claims. Entities are the people, places, things, or events about which the database stores information.
Once you’ve identified the entities, you’ll notice that each one comes equipped with it’s own set of Attributes. In the case of customers, for example, those attributes might include first name, last name, customer ID, street, city, and more. Attributes are the things you need to know about entities or that help to distinguish one entity from any other entity in your proverbial boat.
The important thing to remember is that entities and attributes do not stand alone. They interact and help define each other in any number of ways. And it’s these interactions that entity relationship diagrams help to visually map out and make sense of for those of us who don’t speak and dream in spreadsheet form.
A simple example
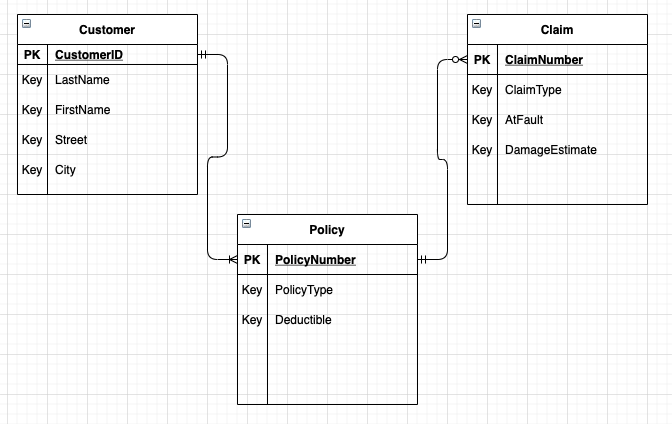
Let’s say you’ve got three entities – let’s go with “Customer,” “Policy,” and “Claim.”
To begin our diagram, we’ll create something like this:

You’ll notice the entity names up at the top. The rows below are for the attributes (or keys) that define that particular entity.
After labeling those keys, we might get:

Now comes the diagramming part. We need connectors to show us how these entities are interrelated:

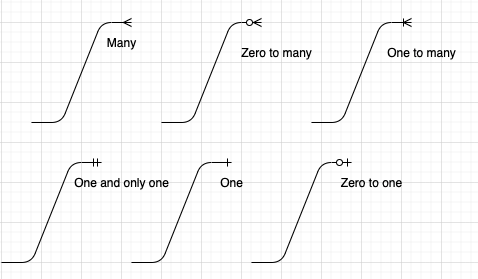
Notice the connectors at the top of the lines above. Those are indications of “cardinality,” or, in simple terms: This entity on the left is able to be related to X number of this entity on the right:

…and these same notations can be used at the other end of the connector as well. So, in our example we see this:

This tells us that a policy number can be related to only one customer ID. A customer ID can be related to one or many policy numbers. A claim number can relate to only one policy number. And a Policy number can relate to zero or many claim numbers.
You’ll also notice, as you explore ERDs further, the notations “PK” and “FK” associated with some attributes. These refer, respectively, to “primary key” and “foreign key.”
CustomerID is the primary key (PK) for a customer, because no matter how many customers you have, each customer can have only one customer ID. It’s the one, unchanging key that defines each customer. A foreign key (FK) is simply an attribute that originates with one entity, but can also be used to partially define another entity.
Complicated? No.
It’s easy with draw.io
draw.io for Confluence helps you intuitively translate your most intimidating databases into ERDs. There’s no special technical knowledge required to start diagramming, and it comes pre-equipped with all the shapes and connectors you’ll need. We’ve even inserted a video below to prove just how easy it is to create a more complex ERD.
draw.io is 100% integrated into Confluence, so you and your entire team can collaborate and share diagrams in real-time or asynchronously.
You can even create ER diagrams directly from SQL. We’ll show you how in the video below!
And we know that, in the insurance industry in particular, security is crucial. That’s why draw.io offers the Gold Standard in security and privacy. No diagram data ever gets tracked or saved outside your deployment. There’s no sharing with third parties. No transit through third-party servers.
What happens in draw.io stays in draw.io.
Here’s some more information to outline the many ways in which draw.io puts your security first:
- Security in Confluence Cloud with draw.io
- Introducing Data Governance in our Standard draw.io plan
- Your diagram data is private and secure with draw.io
- Atlassian’s Bug Bounty Program: Making draw.io even more secure
Video proof
You are currently viewing a placeholder content from Youtube. To access the actual content, click the button below. Please note that doing so will share data with third-party providers.
More InformationVisit our YouTube Channel, or book a free demo to learn more about the limitless ways in which draw.io can make your diagramming life easier!
Last Updated on August 17, 2023 by Admin

