Where there’s a will, there’s a diagram
There’s nothing you can’t visualize. To share your concepts and ideas, you need a reliable partner as versatile and flexible as your business. This page gives you an overview of use cases where draw.io helps teams around the world work better together every day.
Software, Network, and Engineering
The heart of visualization in the enterprise environment is technical documentation. Standardized modeling languages help you document and design soft- and hardware architectures or to show the relationships between attributes in business processes.
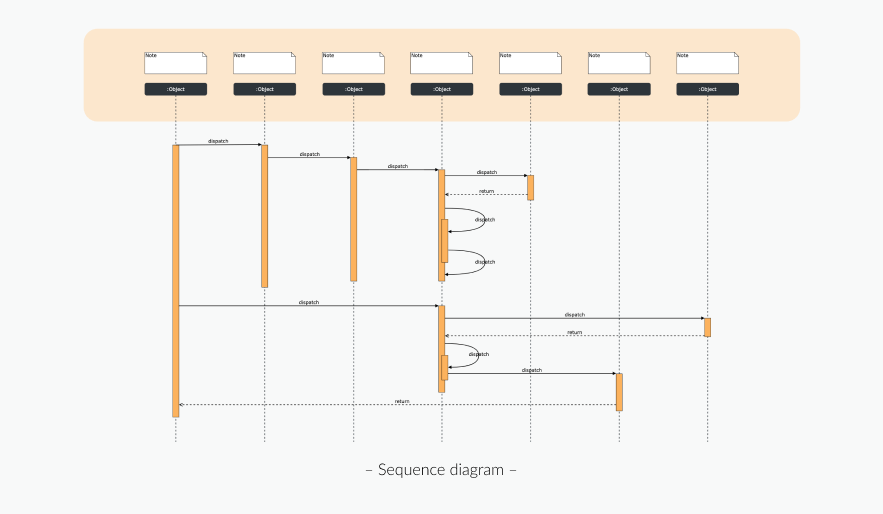
Unified Modeling Language
This general-purpose modeling language helps you visualize a system’s design – especially in software engineering. UML can represent structural information (such as class diagrams), behavioral information (like use case diagrams), or display interactions (e.g. a sequence diagram).
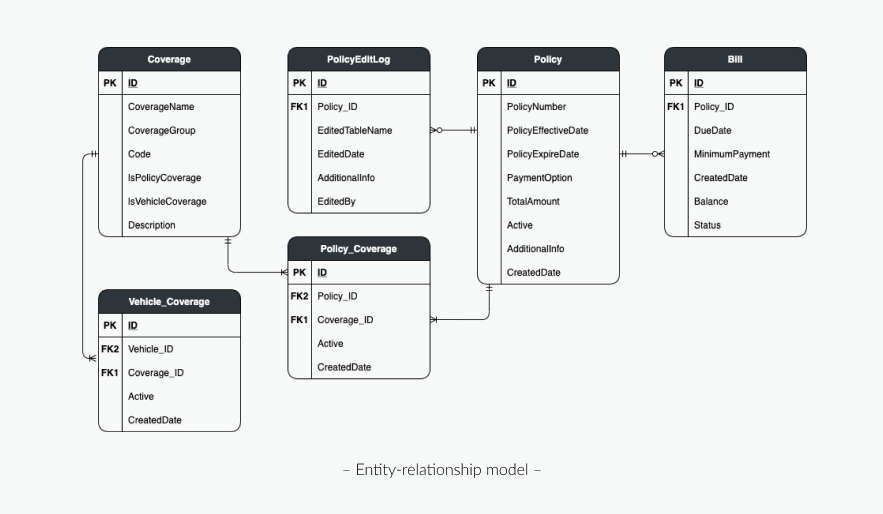
Entity-relationship model
ER diagrams are used to visualize relationships between specific entity types. The intention is to use entities, attributes, and relationships to define a later implemented structure in a relational database.
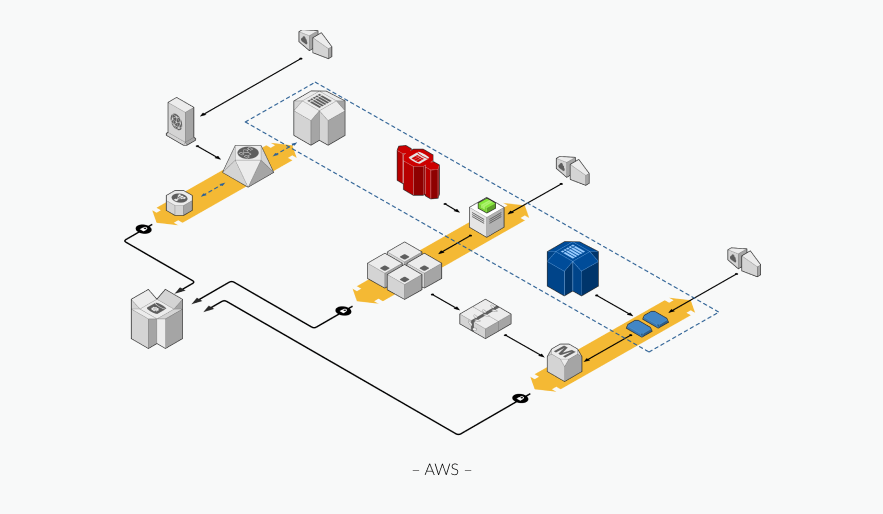
Visualize your Cloud infrastructure
The world is heading towards on-demand cloud computing platforms. Web services provide a variety of abstract technical infrastructure and distributed computing building blocks. Visualizing your set of services is a must for managing platforms like AWS, Azure, GCP, or IBM.
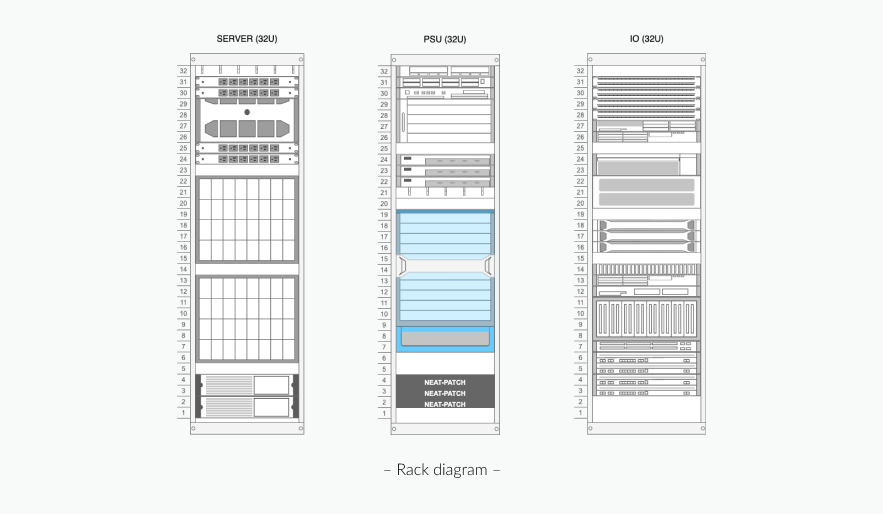
A must-have for every business
Documenting your internal networks is crucial to your business. You can show the dependencies between your network’s physical components and their functional organization and configuration, as well as its operational procedures and communication protocols.

Power on your diagramming skills
Engineering diagrams include a variety of different use-cases. You can draw process flows to visually communicate maintenance plans for engineering systems from electrical to wiring schematics or mechanical diagrams.
Business, Charts, and Maps
When we talk about Business Diagrams, we mainly talk about mapping business processes. But there are so many more use cases than flowcharts or BPMN 2.0 diagrams. For example, how about a mindmap for your last meeting?

Visualize simple processes
Flowcharts consist of a manageable set of objects – which makes flowcharts easy to understand and use. Flowcharts are used for lightweight processes, but at the same time, they are also the entry point for more complex diagram languages such as UML or BPMN 2.0.
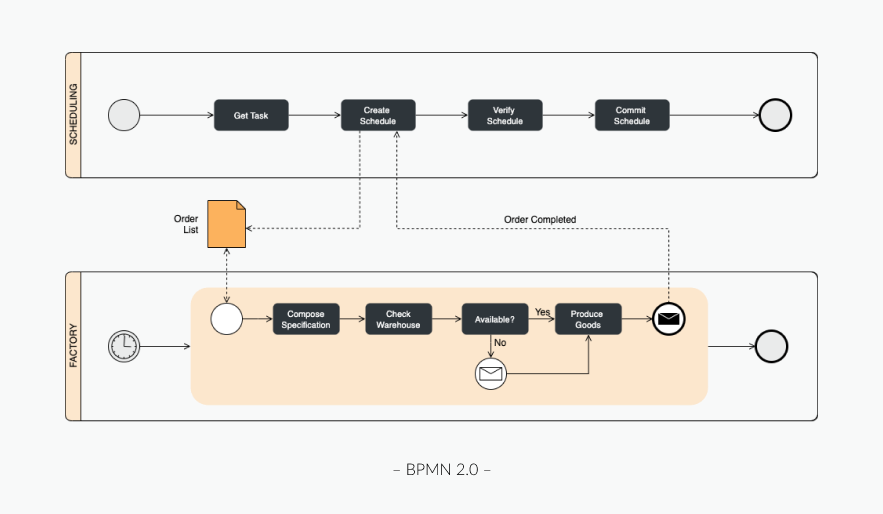
Business Process Model and Notation
BPMN 2.0 provides a graphical notation to specify business processes. Based on the flowcharting technique, it offers standardized objects like events, activities, gateways, connections, and swimlanes, making it a common language for all stakeholders of business processes worldwide.
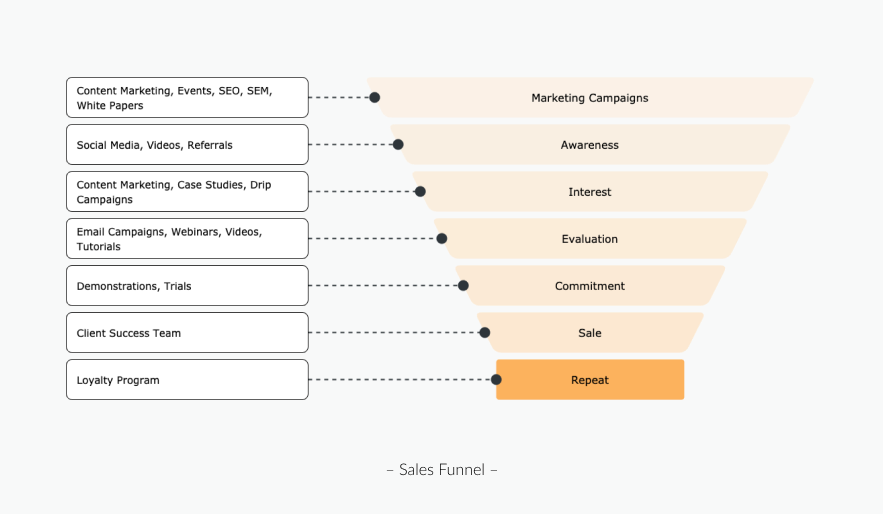
Upgrade your business reports and concepts
Every business thrives on visualizing concepts and ideas. There are many standardized forms of visualization such as SWOT diagrams, sales funnels, or the Boston Consulting Matrix. Of course, you can also cast individual content into diagrams.
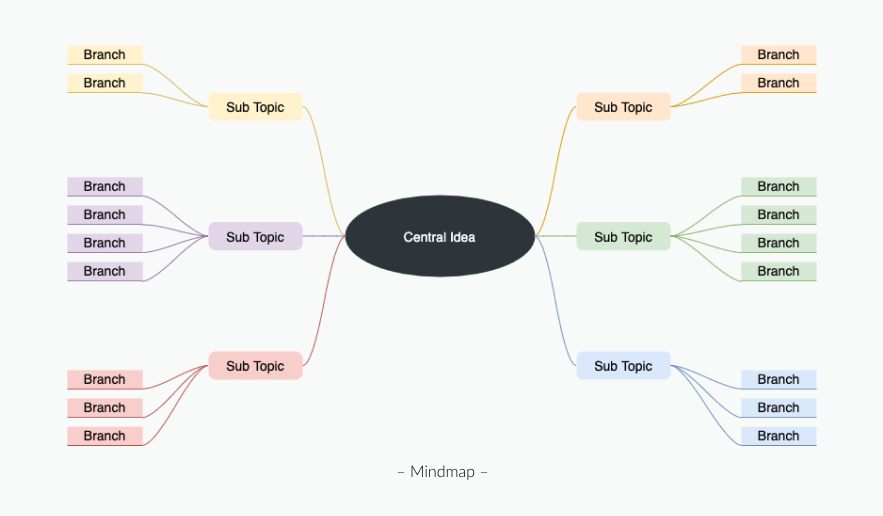
Build a hierarchical map of your ideas
The philosophy of a mindmap is to take a main idea or concept as the central component and show all the relationships emanating from it hierarchically and organized in a branch structure. The mindmap is one of the most prominent representatives of Tree diagrams.
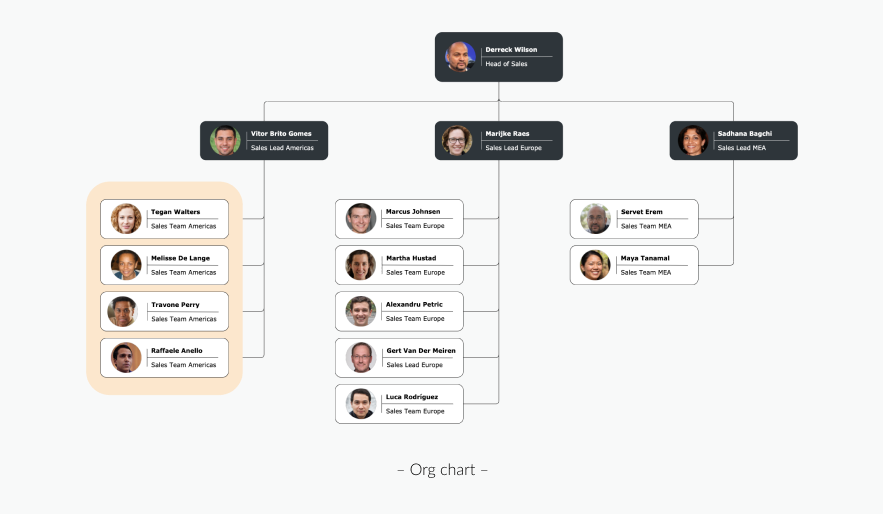
Charts are the diagram jack-of-all-trades
The everyday use of charts is to visualize data, as in a pie or line chart. But they can also organize quality information. The most known example here is the org chart that is used in nearly every company. Charts are as versatile as your business.
Wireframes, Graphics, and Tables
Welcome to the area that you may not think of when you think about diagrams. Business processes and architectures are critical to your business. But do you know how much value a floor plan or a meaningful infographic can have? The good thing is… draw.io can also help you with these use cases.

Time for orientation
Need to plan your new business premises? Or simply document plumbing and electrical systems for your facility management? Of course, you can also create seating plans to orient new employees, and individual departments can be found quickly.
The power to sort things out
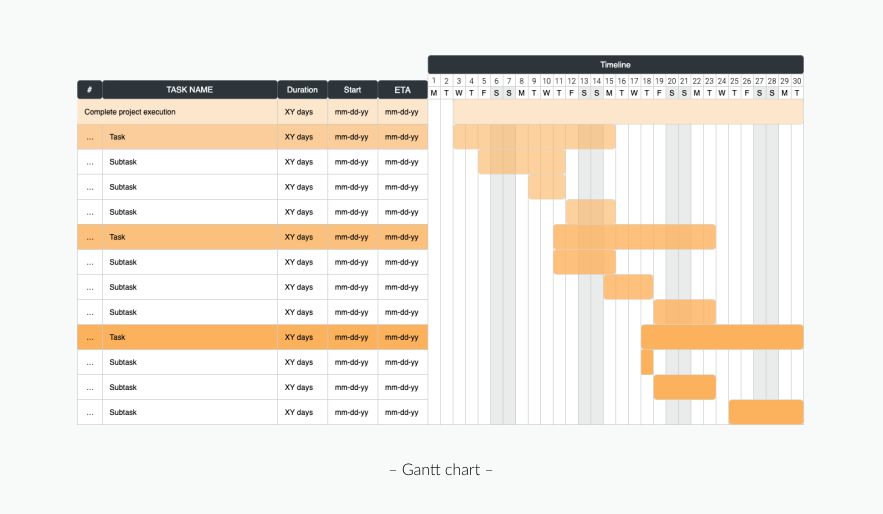
Tables are as versatile as your business. They help you to display data in a structured way. You can either use a simple table, show dependencies in a cross-functional table, or create a Gantt chart to manage your projects.
A picture is worth 1,000 words
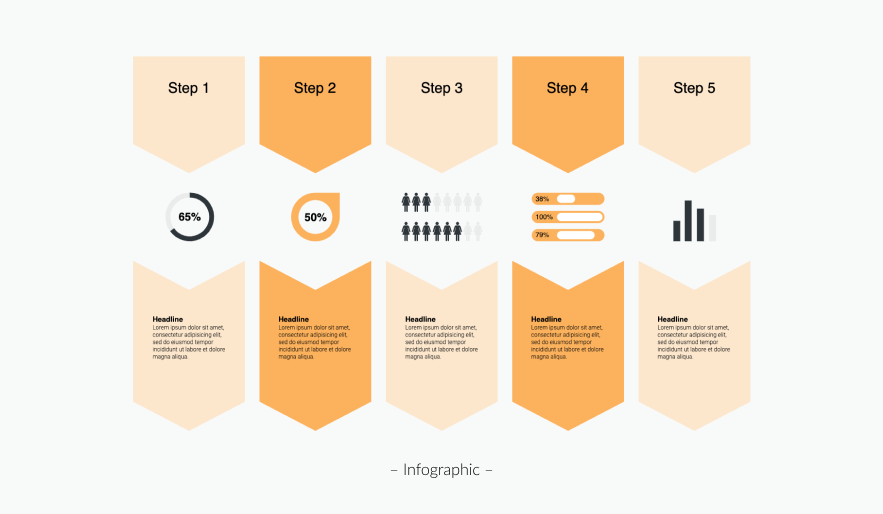
Replace your written instructions, guides, or tutorials with a powerful and easy-to-understand infographic. The use cases are almost endless. You will immediately notice that your content is better absorbed and remembered longer.
Design follows function
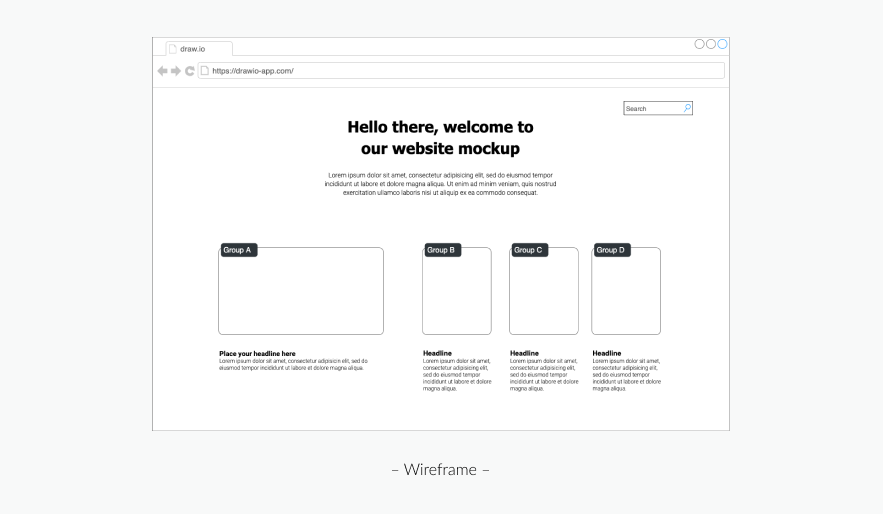
A wireframe represents the skeletal framework of your new website, app, or digital service. The layout of a wireframe focuses on functionality rather than style. If you want to sketch out what the solution will do, a wireframe is your way to go.
Show the logical relationship between sets of data
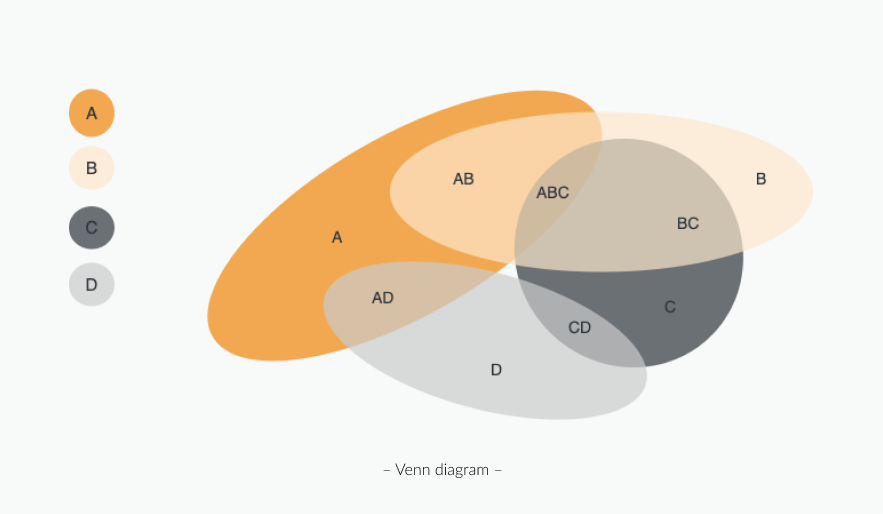
A Venn diagram (also called primary, set, or logic diagram) organizes data in sets that usually form an ellipse. These ellipses can overlap each other in every possible way, showing the relations between each of the sets.
Begin your journey with the #1 rated app
Get your 30 days free trial in the Atlassian Marketplace
or simply book a demo for a personal meeting.


