
The world outside has changed dramatically. We’ve all had to rethink how we work to make the best out of the situation we’re in. Especially now, transparency, efficiency, and consistency have become even more important. Visualization can help you achieve all three. Here at draw.io, we’re always thinking of ways to help you make the most out of your diagramming experience. So we’ve come up with a few ways you can use draw.io diagrams to tackle the challenges of Covid 19, so you and your teams can be prepared.
Mind maps
When you’re in the planning stages of approaching your Covid-19 procedures, mind maps are always very helpful in getting as many of your ideas down as possible. You and your teams will be able to collaborate, fleshing-out ideas on procedures that are in line with Governmental Health Compliance Guidelines. What are the steps your organization has to take? Work through the what-if’s and be proactive to prepare rather than be reactive.
If you want to leave someone information directly on the diagram, that’s also possible with draw.io. This is especially helpful for giving your team information on changes made.
To access the comments panel:
- Save your diagram if you haven’t yet (or you won’t be able to view comments)
- When back in edit mode, go to View in the menu bar
- Select Comments
You should now see a pop-up. Click the + sign to add a new comment and then save it. The next person that works on the document can access the comments panel in the same way. Then, they can click the refresh icon to see any new comments since their last visit.
Infographics
With so much information being shared with us every day, it’s important that we can quickly filter out the most relevant. Infographics help you do that at a glance! Visualize the most common hygiene procedures, such as hand washing or ventilation requirements. With an infographic, you can create easy-to-follow routines that leave no room for misunderstandings.
Infographics are a bit more time-consuming, and it’s important that you get the most out of your learning. Why not head on over to the blog post on how to create an Infographic in draw.io.
Flowcharts
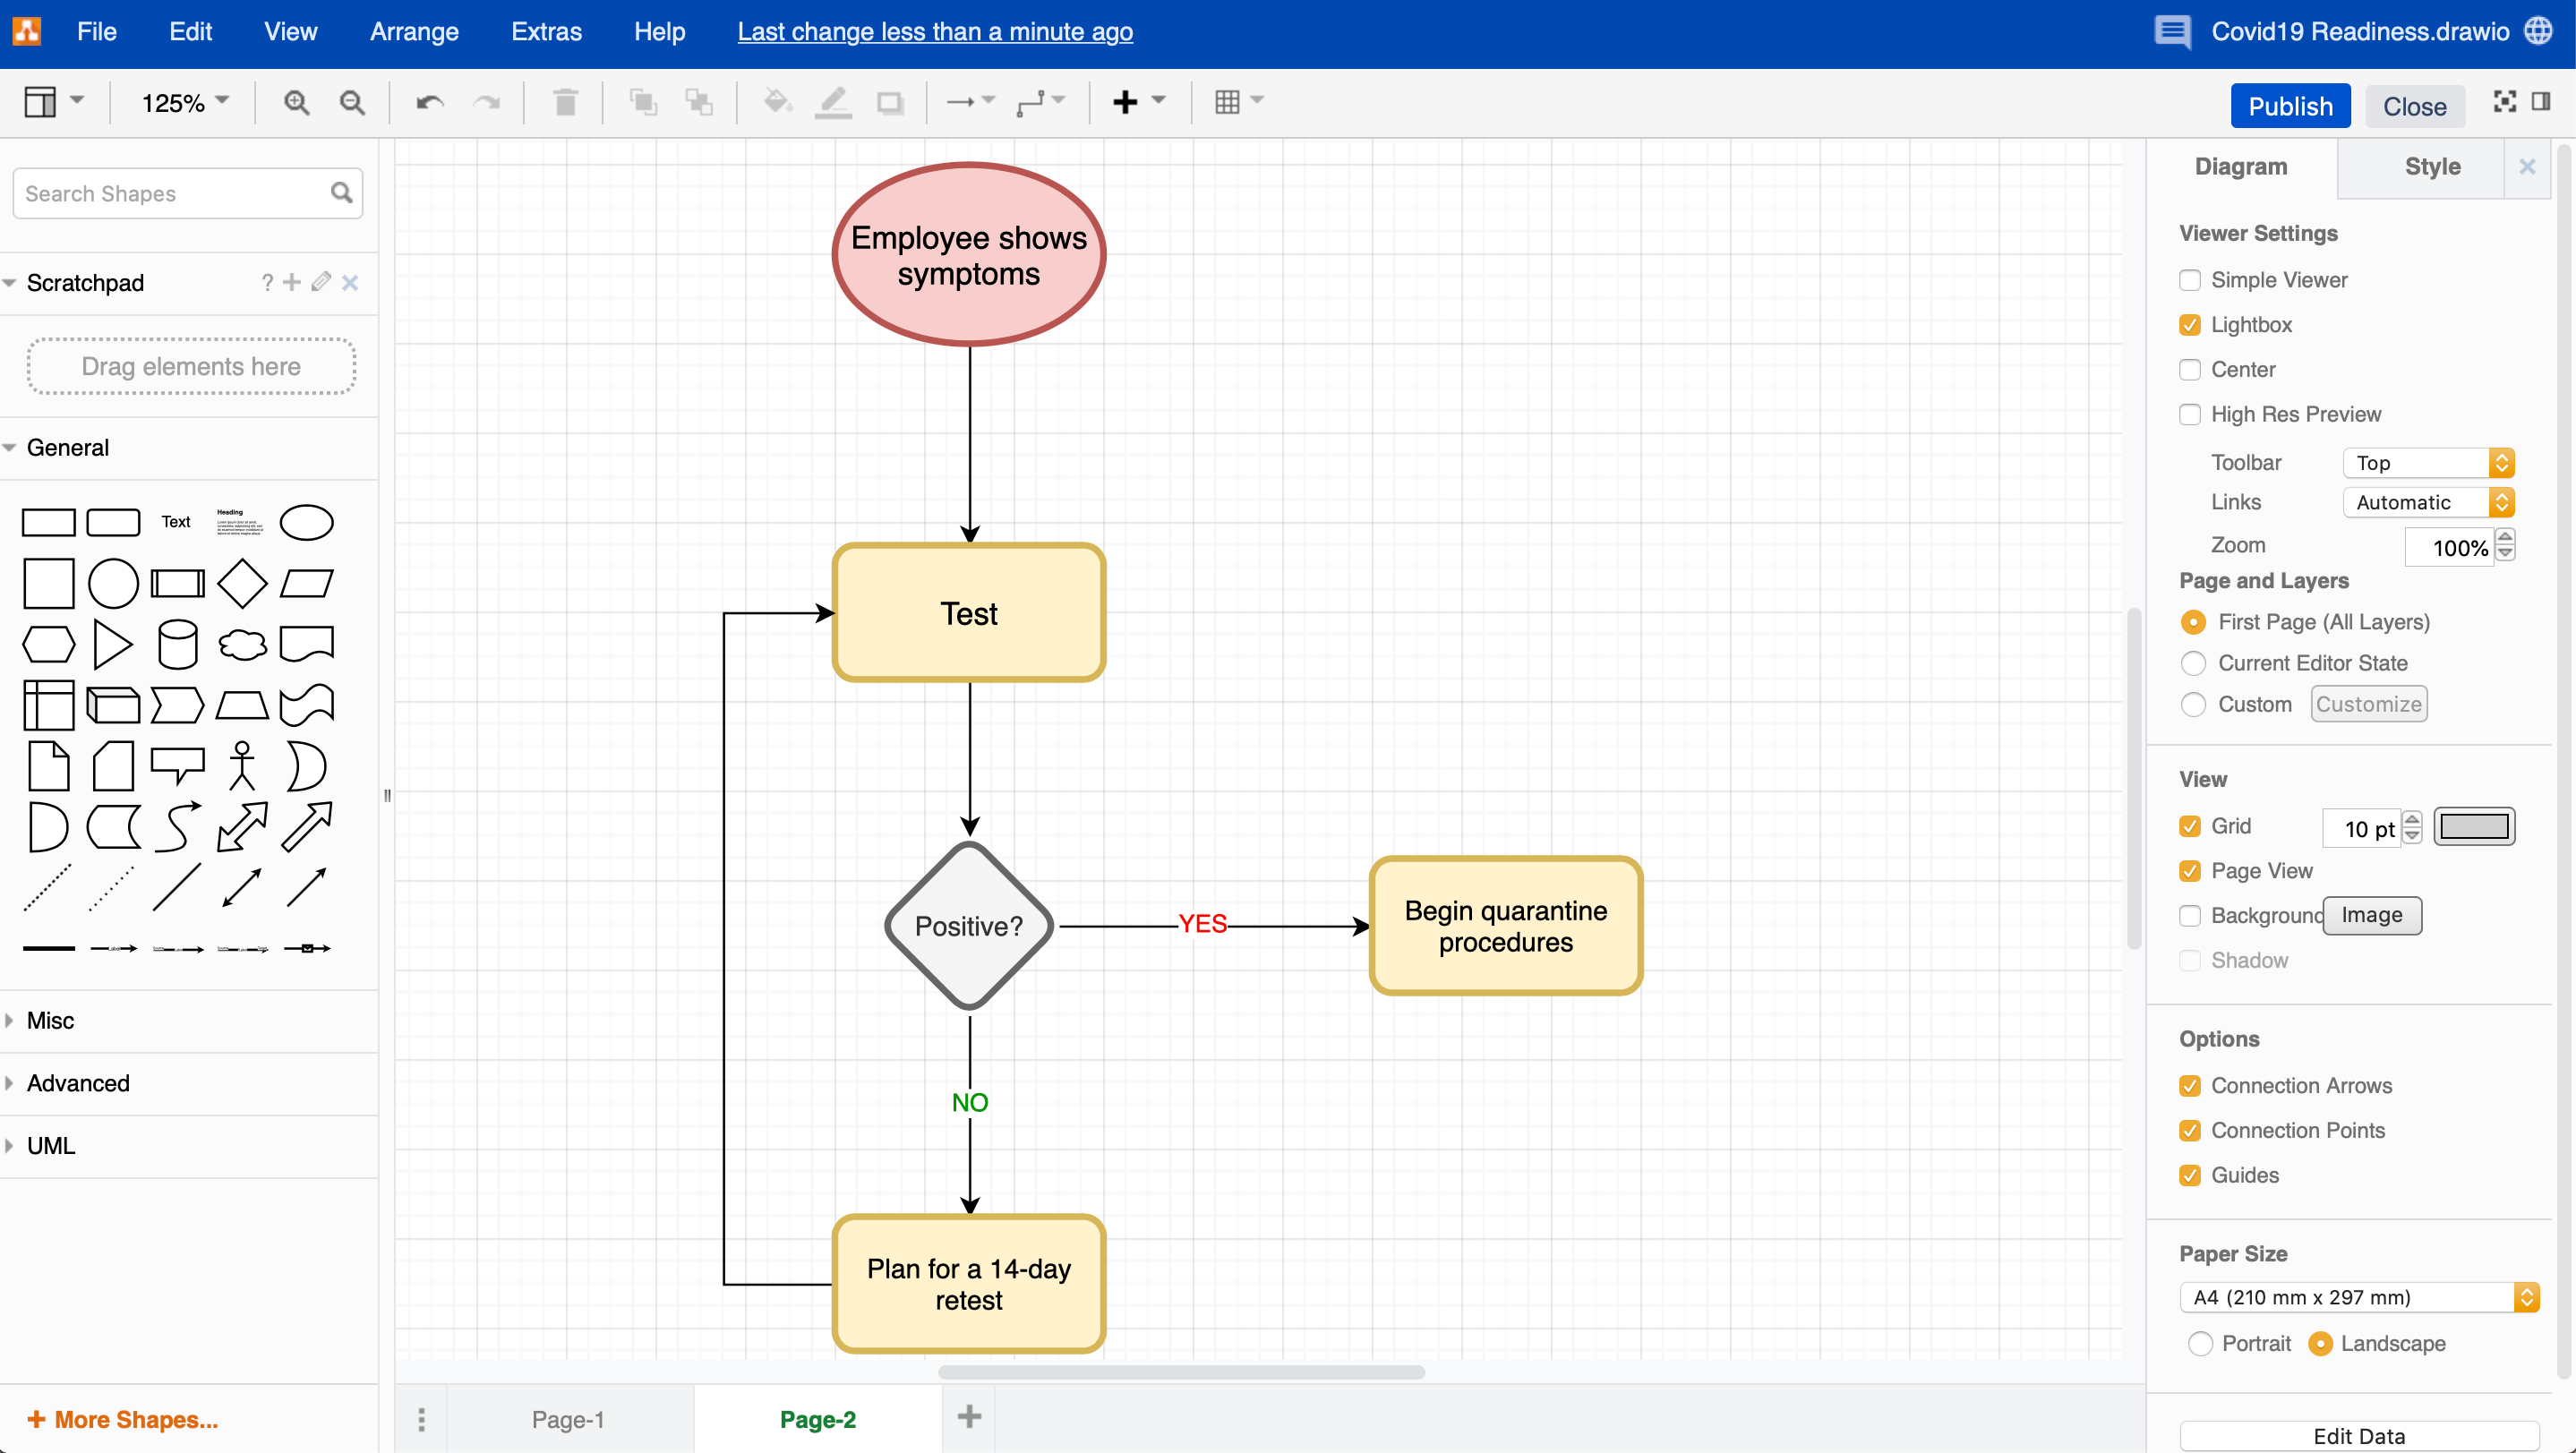
When you think of flowcharts, you think of procedures. Having a visual representation of repetitive tasks helps identify the “what if’s” and bottlenecks. That way, you and your teams can have consistency and react quickly to changes.
Although there are many ways to create flow charts in draw.io, one of the fastest ways is to use the Shape Picker menu.
- Double click on your drawing area to open the shape picker menu,
- select the shape for the start of your process,
- hover over that shape until the faint blue arrows appear, click on one, select the process shape from the shape picker menu,
- and repeat these steps until you have the flow chart you need!
When you’re done, you should end up with something like this!
Floor plans
Give your teams a way to find hygiene stations quickly with a floor plan. If you have a large office, you can help people find their way to essential locations for their everyday hygiene needs. This is especially helpful if your company is spread out over multiple floors or buildings.
Floor plans can also be used to give teams within your organization information on how many people are allowed to congregate within a designated area. That way, you can avoid mass gatherings that are not in line with your company’s guidelines.
To create a floor plan, why not use a template to get started quickly. The floor plan shapes are not available per default in the shape library, and you will need to add them if you haven’t already done so. To add them:
- Click on the + More Shapes… option at the bottom of your shape library,
- scroll down the menu that pops up until you reach Other,
- then, click the checkbox that says Floorplans,
- and then hit the Apply button to add.
You can now place all the elements you need directly from the shape library onto your drawing area. The floor plan shapes will now stay in the library the next time you open draw.io.
Venn Diagrams
In case your company or team hasn’t gone into full home office mode yet, Venn diagrams are a great way to display and view overlap situations. Use the Venn diagram to visualize contact situations so you can quickly see how to proceed with further testing and possible quarantine. See how Person A interacted with Person B and where they both had contact with further employees.
Begin with a template:
- Go to the menu bar
- select Arrange
- then click Insert then Template…
- select Venn in the window and click Insert
Now you can change the text as you need to without needing to deal with other things. This saves you time, which is very important when dealing with these kinds of situations.
Being prepared is half the battle.
Having information is one thing, but how you use it, react to it, and share it is another. Your company will benefit in the long-run from any visualization, whether you’re dealing with Covid or not. Having the skills and the information to deal with more serious situations can make the difference between a good company and a great company.
We’ve shared a few of the ways some of the diagrams could help you concerning Covid, but why not take a look at the rest of our blog to see what else draw.io can help you with! Not sure where to begin? Why not start with our Learning hub?
Have questions or just want to get in touch? We love hearing from you, so head over to our Support page to see how you can say hi!
Last Updated on October 30, 2020 by Admin