Back in the day, some of the best advice I ever learned was given by a deputy school principal at my middle school.
An authoritative figure, he addressed our class and explained that the exams we were about to take would determine our future.
He offered three golden rules in taking any exam.
-
-
- Read the Question
- Read the Question
- Read the Question
-
Then he went on to explain that many students, in the heat of the moment and under pressure, misinterpreted the question and gave wrong answers.
The person marking the exam could see the students thinking and knew the student was intelligent and knowledgeable, but a wrong answer is a wrong answer.
In this blog post, we look at how diagrams can play a vital part in ensuring customer satisfaction and how diagramming can ensure we don’t misinterpret our clients.
Misunderstandings
It boils down to simply understanding what the customer wants. Not what we think they want, but really what they want, and how can we avoid contractor-client misunderstandings.
“Customers don’t want to buy a quarter-inch drill. They want a quarter-inch hole.” Professor Theodore Levitt, the legendary marketing scholar and former Harvard Business Review, editor.
Jobs to be done framework
One method to avoid these errors is the Jobs To Be Done (JTBD) theory. It states that purchasing decisions are mainly about completing a task. Users don’t buy products or services. Instead, they pay for them to do a job.
It might be a customer request or product evolution, but it all hinges on knowing what the market wants.
“If you develop a product that gets what the customer is trying to get done, you don’t have to advertise; people will just pull it into their lives.” Clayton M Christensen
Visualization
The key to the Jobs To Be Done approach is visualization, not just one diagram but many, each building on the ideas spawned by the previous diagram.
Customer requests
An inquiry may be a customer request, an existing client needs a modification, or perhaps an entirely new solution. Both sides are energetic and keen to move forward during these initial stages, but misunderstanding can arise. For example, how many times after an initial meeting has the customer thought, “strange they never asked about….” Or has the development team thought, “we forgot to ask…”
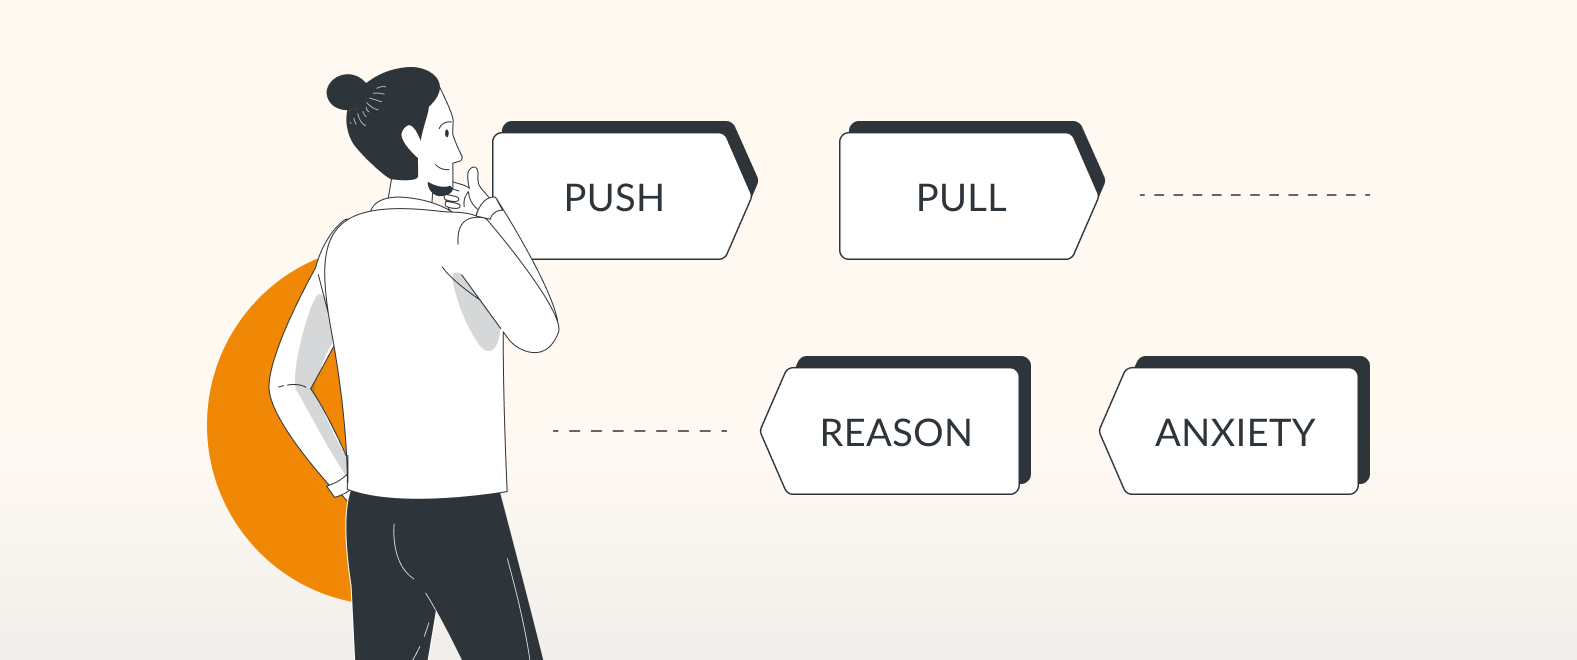
Market forces
Here we can use Force Diagrams to clearly define the Product Push (why are we doing this) and Product Pull (the attraction for our customers). But again, some forces rally against change. Diagramming these conflicting forces helps clarify the decision to proceed or not to.
Fleshing out the requirement
Here Flowcharts are an essential tool. Following a decision-making process ensures all bases are covered. The same essential questions are asked regardless of the project.
A Flow Chart imposes discipline. It guides the team through acquiring the essential data, a process of questions, and information requests.
They help ensure nothing is missed, critical points are discussed, and minimize the risk of specific issues returning to bite later.
Value Proposition and User Personas
Or perhaps it’s a new product or product evolution. It’s pretty standard for businesses to develop User Personas or business descriptions of their existing or potential new customers.
Employing the User Persona, the next step is to create a Value Proposition Canvas that can graphically help define precisely what the target market seeks.
Diagramming again is the essential tool in building User Personas and Value Propositions based on these Personas.

- Open Confluence.
- Open draw.io (blank diagram).
- Drag & drop your XML file into your blank drawing area.
- Use it as a custom template if you like.
Client-customer relations will never be the same again
This blog post touches on improving Contractor Client communication using the JTBD approach.
But the real gamechanger in JTBD methodology is in using draw.io’s new Board editor, enabling both developer and client to interact and work side by side on projects even if separated by continents. Every idea and modification time-stamped and stored in Confluence.
Customer sales can be in California, Marketing in Texas with the Contractors / Developers in London and Bangalore all sharing the same diagram, each with the ability to modify diagrams posing and reacting to “what if” scenarios.

Keen to learn more, visit our YouTube Channel for a constantly updated playlist of how-to videos.
Visit our one-stop tutorial shop to pick up all the ins and outs of draw.io diagramming.
Or book a free demo to learn more about the limitless ways in which draw.io can make life easier and more productive for you and everyone in (and outside) your company!
Happy diagramming!
Last Updated on October 18, 2022 by Admin