An Org Chart is a diagram that visually represents the structure or reporting/relationship hierarchy of an organization. Org charts can be structured in a variety of ways and are useful as a management and planning tool or even as a personnel directory. You want to show work responsibilities and reporting relationships, allow employees to better understand how their work fits into the organization’s overall scheme, help leadership more effectively manage growth or change, and improve lines of communication? You need an Org Chart!
But you already know what Org Charts are and what they’re good for, the question today is how to bring your Org Chart game to the next level. And the answer is: With draw.io and Confluence.
You use Confluence as your single source of truth. It’s your go-to place for sharing everything that deserves to be shared throughout your company. So it only makes sense that org charts should be among the many volumes of information available to your employees through Confluence. As the top-rated Confluence diagramming solution, coming from one of Atlassian’s biggest partners worldwide, draw.io is the best way to make that happen.
A tale of two Org Charts
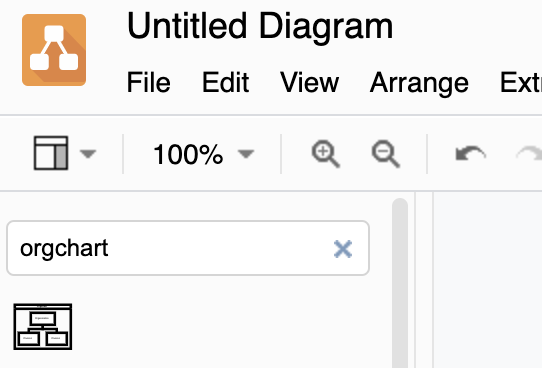
Click on the resulting thumbnail to get a ready-made org chart container that you can customize on the draw.io canvas.
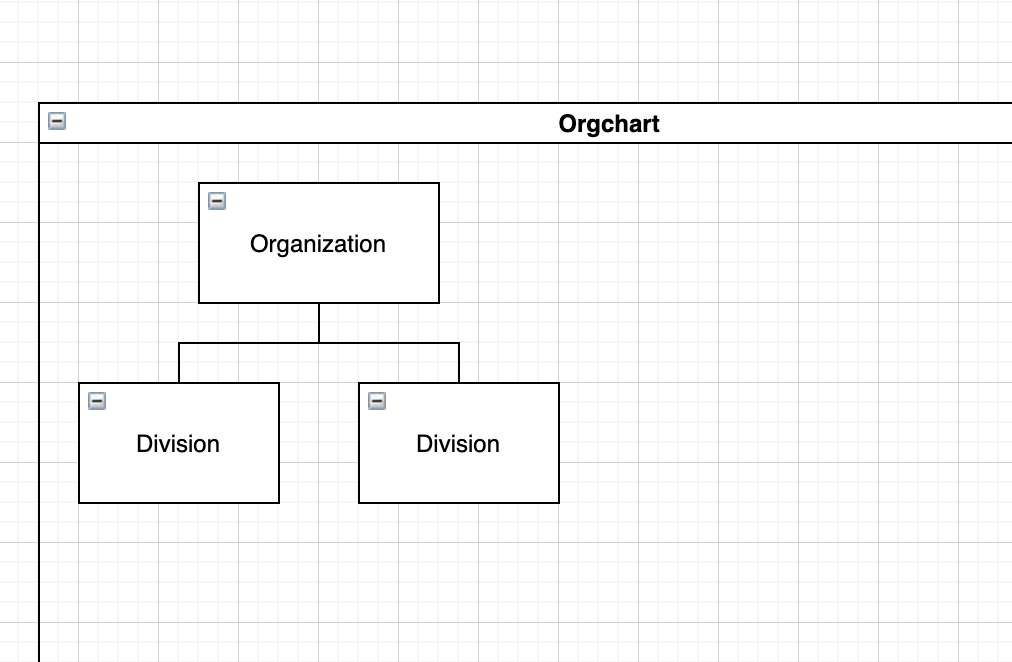
The container comes with a bundle of predefined settings, and it will expand as you add shapes to your chart. You can build your organizational trees and then format, sort, move, collapse, and expand them. It’s quick. It’s easy. It’s intuitive. (Here’s a quick org chart video from our YouTube channel to get you started).
When it’s all said and done, you’ll get something like this:
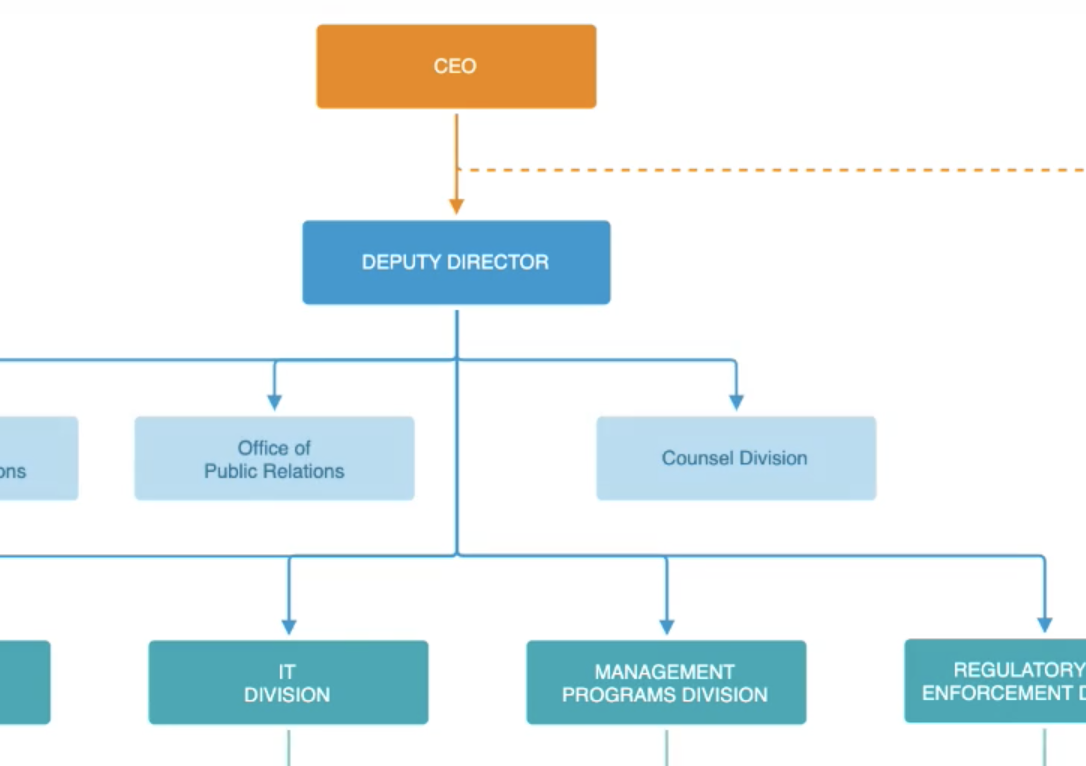
Nicely done.
But wait…
Sometimes you need something more detailed. More informative. More pleasing to the eye. More presentable and useful for both your employees and those outside of your corporate bubble. Let’s talk about custom libraries.
With custom libraries, you can include your own graphics and icons in your org chart (or other diagram) by quickly and easily importing them into draw.io.
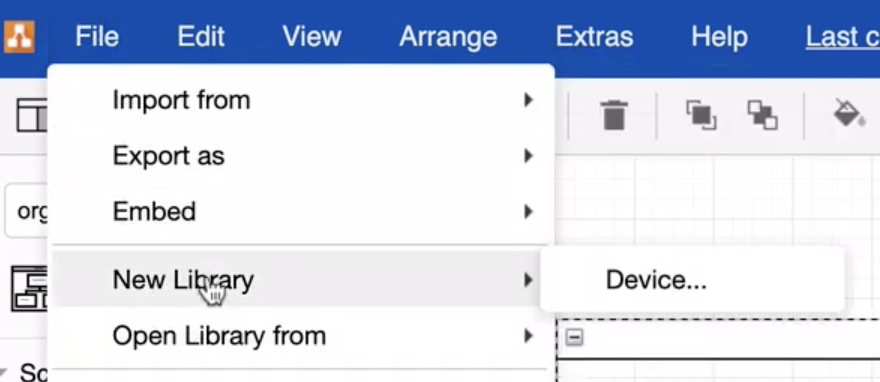
Your library can include images of the inhabitants of your org chart as well as specialized shapes and graphics of your own creation. Perhaps something like this:

Once imported, it’s all searchable by name, title, division – whatever information you decide to include – so everything’s easy to find. And when you’re finished, you can have something that looks more like this:
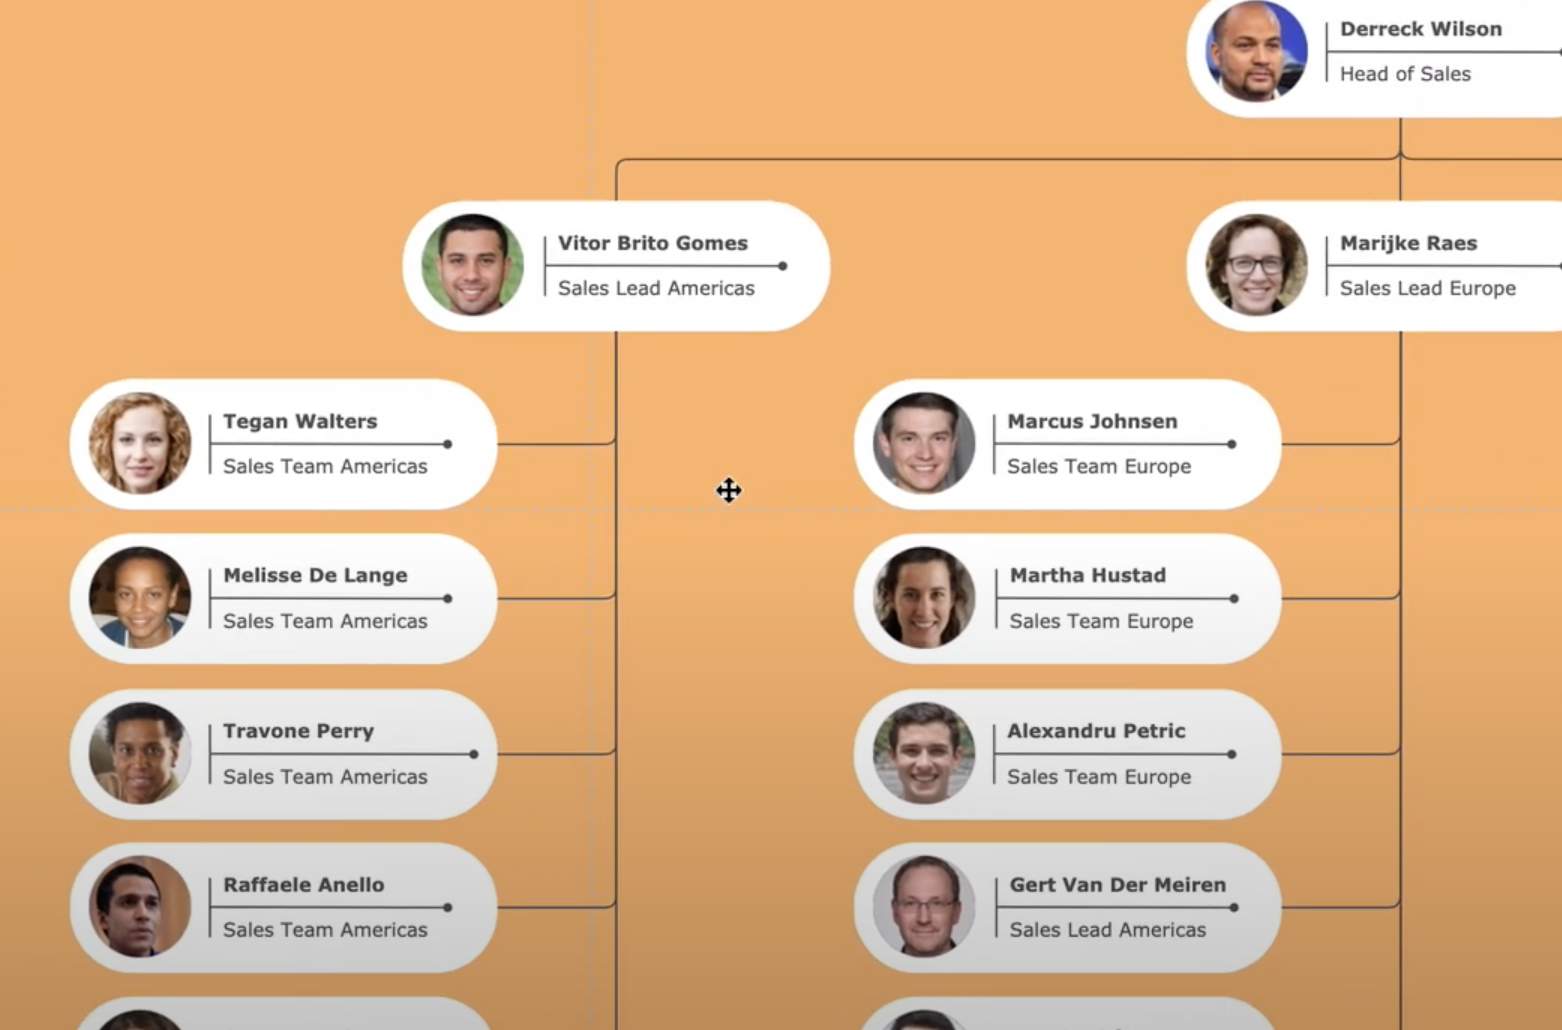
With all the manipulation features of the simpler chart above. And here’s a custom org chart video for you.
Check out this custom libraries video to get started on your own custom libraries, and don’t forget to book a free demo to learn all about the magic of draw.io!
Last Updated on October 20, 2022 by Admin

