Attention: Since the publication of this article, there is also the possibility to create a Gantt chart via AI using our Smart Template feature. You find more information in our blog.
Ahhh multitasking, the sometime red-headed step-child of productivity and efficiency. There are many die-hard fans of being able to juggle multiple tasks at once, but some say, multitasking is the ultimate productivity killer. We’re not here to give you life advice, just tips on diagramming so naturally at draw.io we have a way to accommodate all of you. Project managers are unsung heroes. Trying to keep tasks, teams, and deadlines under control isn’t an easy job. Today we’d like to show you how you can increase productivity with Gantt charts in draw.io.
A what chart?
In the later part of the 1800s, Karol Adamiecki, a polish engineer, created a tracking method which he called “harmonogram.” This is basically a very fancy word for a scheduler. The creation of this tool lead to an increase in productivity of between 100% and 400% after implementation in factories and mills¹. A few decades later, inspired by Adamiecki’s tool, Henry Gantt went on to create his version to help supervisors keep an overview of time-tracking for their projects. And all project managers celebrated!
But how can these Gantt charts help you be more productive in your day-to-day working lives? Imagine that you want to keep track of a project, that requires an overview of several tasks and sub-tasks, as well as multiple teams perhaps. Wouldn’t you want a tool to help you keep an eye on all of that?
Note: This post is quite image intensive, so please be sure to click on the images to enlarge them to see how everything works.
Libraries aren’t just for reading
So, I’m not going to sugar-coat this: creating a Gantt chart in draw.io is easy but is going to take you a little time. But would we even be draw.io if we didn’t find a way to make something easy even easier for you? We know how valuable your time is, so we’ve created a Gantt chart library for you to download and add to your main library in your draw.io workspace. You can download the .xml document as a zip file.
This provides the base modules that you can just click and drag to set up your Gantt chart. The idea is that you take the framework we’ve set up, and with just a few clicks, you can make it your own. We want to get you Gantt-charting as fast as possible so you can get your project going.
Import the Gantt chart library into draw.io
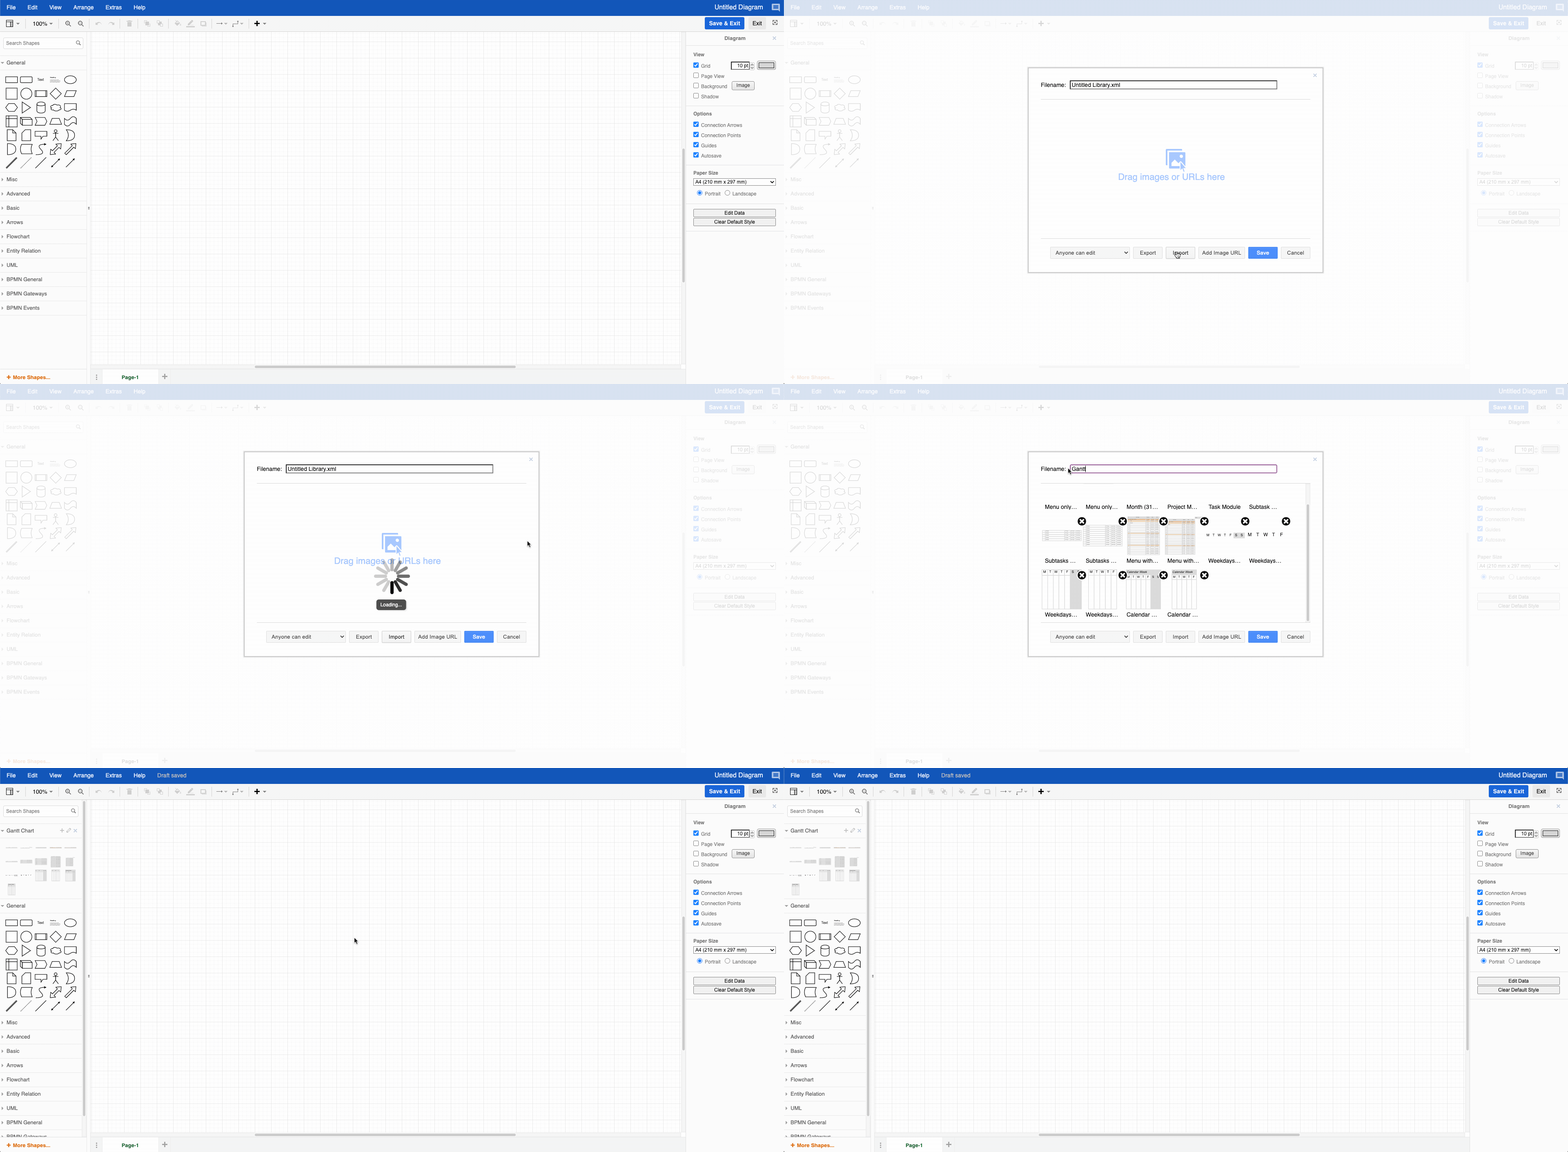
- In your file menu, select New Library and then Import
- From the dialog box, find the downloaded Gantt chart .XML file
- Select it and give it a name (Gantt chart might be better than, say, Bob)
- Hit save, and your new Gantt chart library will now appear in your shape library
Setting up your diagram for use
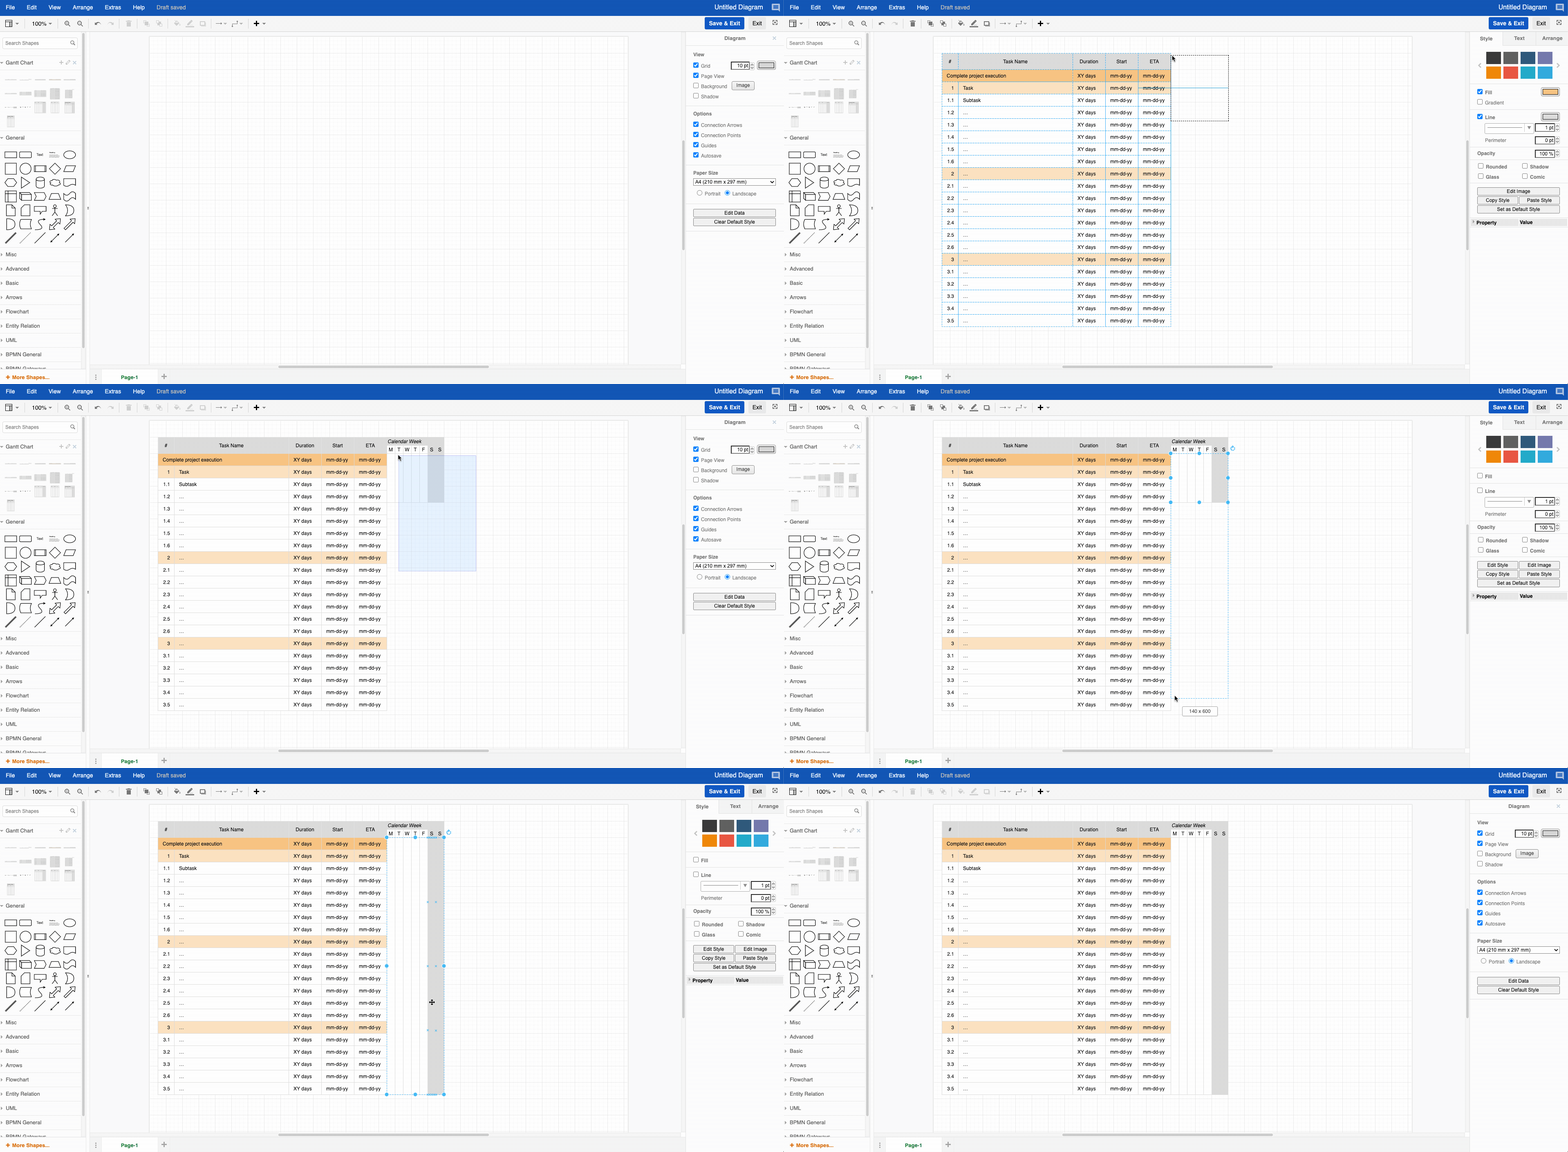
A Gantt chart is a visualization of tasks and their timeline. That’s it. In your new shape library, you will see that we’ve created shape “modules” so that you can start with the set that suits your needs the most. After selecting a task module and a timeline module, you can now double click anywhere there’s text to replace it with your own. You can also customize the colors, which is great if you have many teams working on one project. Assigning teams their own color will help them get work done faster because they will see their tasks at a glance.
Before you begin creating your Gantt chart, we highly recommend that you turn off the connection points and connection arrows:
- Go over to your properties panel (right-hand-side of your workspace)
- Under Options uncheck connection points & connection arrows
Better together
Like a really great belt that keeps your pants up, grouping shapes to move or resize will help prevent things from going where you don’t want them to. Want to move or resize that whole weekly block? No problem:
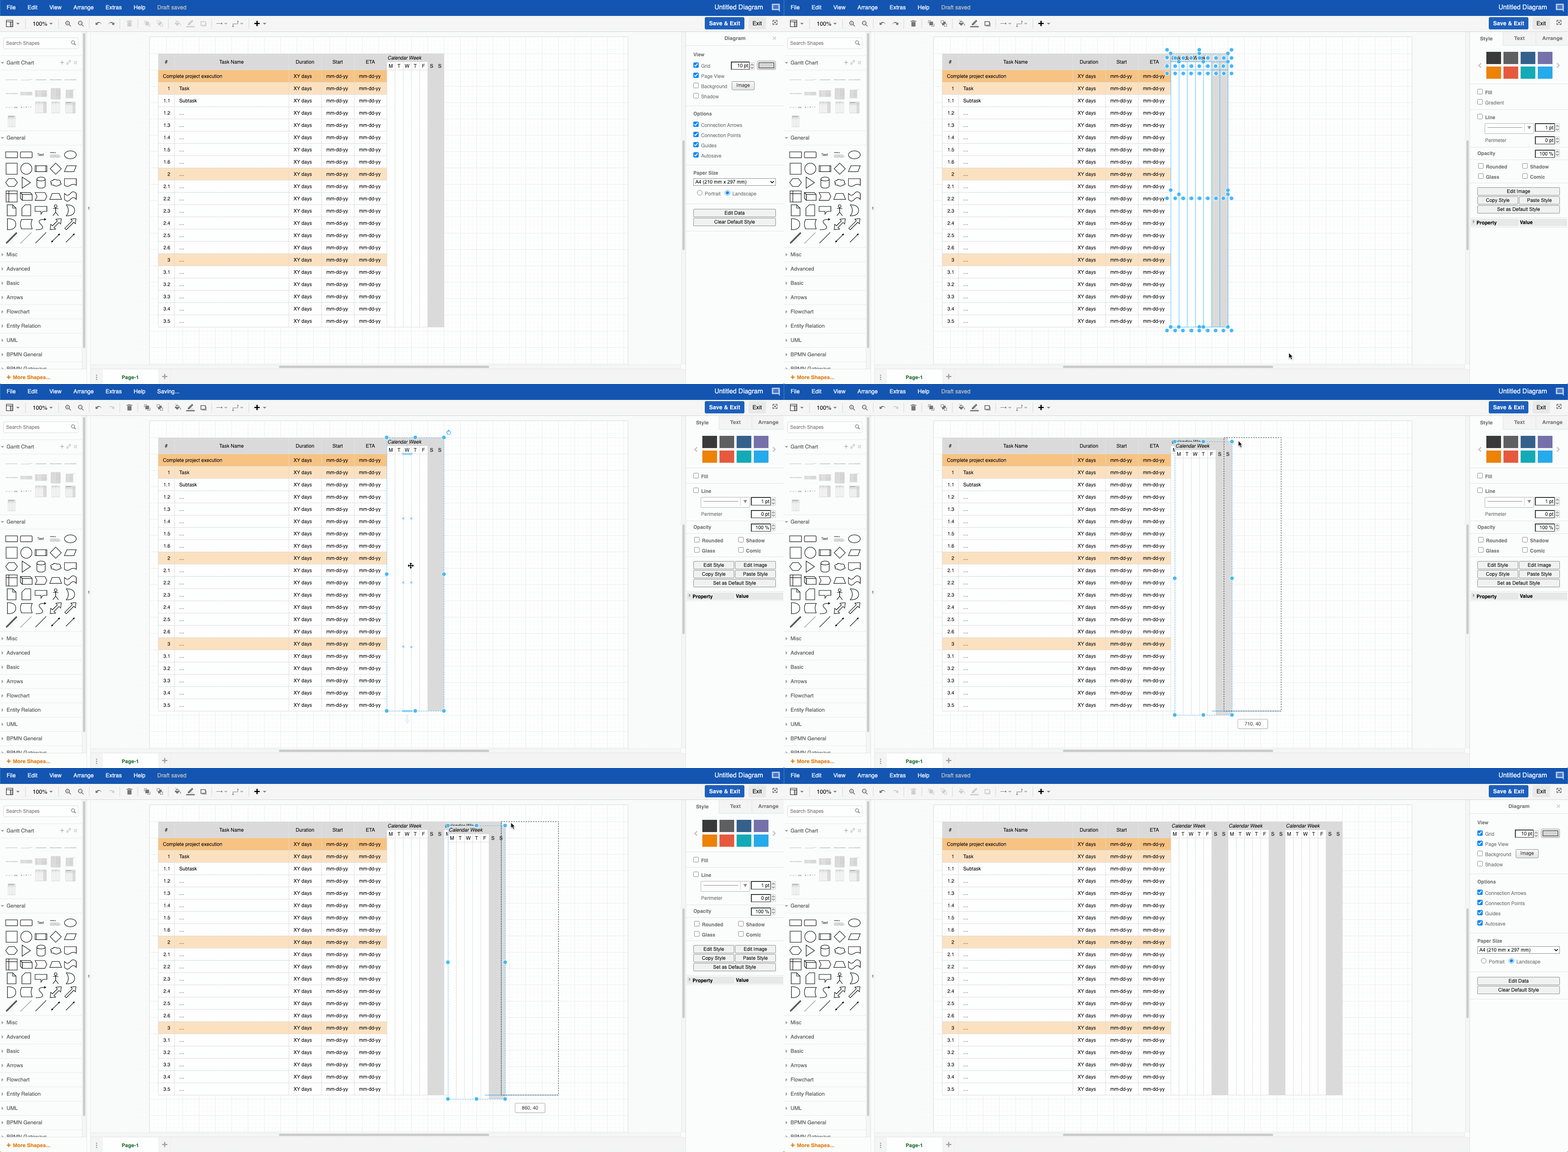
- Select the shapes that you want to group
- Right-click and select group. You can also use the keyboard shortcut ctrl/cmd + G to group
- Move/Resize them to your heart’s content by dragging
- if you want to ungroup, right-click and select ungroup
Group & Duplicate
Duplicate modules while grouped in order to extend your timeline. This will save you huge amounts of time:
- Select the shapes you’d like to duplicate
- Right-click and select Group
- Use ctrl/cmd + D to duplicate that group
- Drag the new module to where you need it
Layers aren’t just for winter
When working with Gantt charts, another tip we’d like to share is that you can work in layers in order to keep stuff “locked”. This will prevent any unwanted moving around of your base chart.
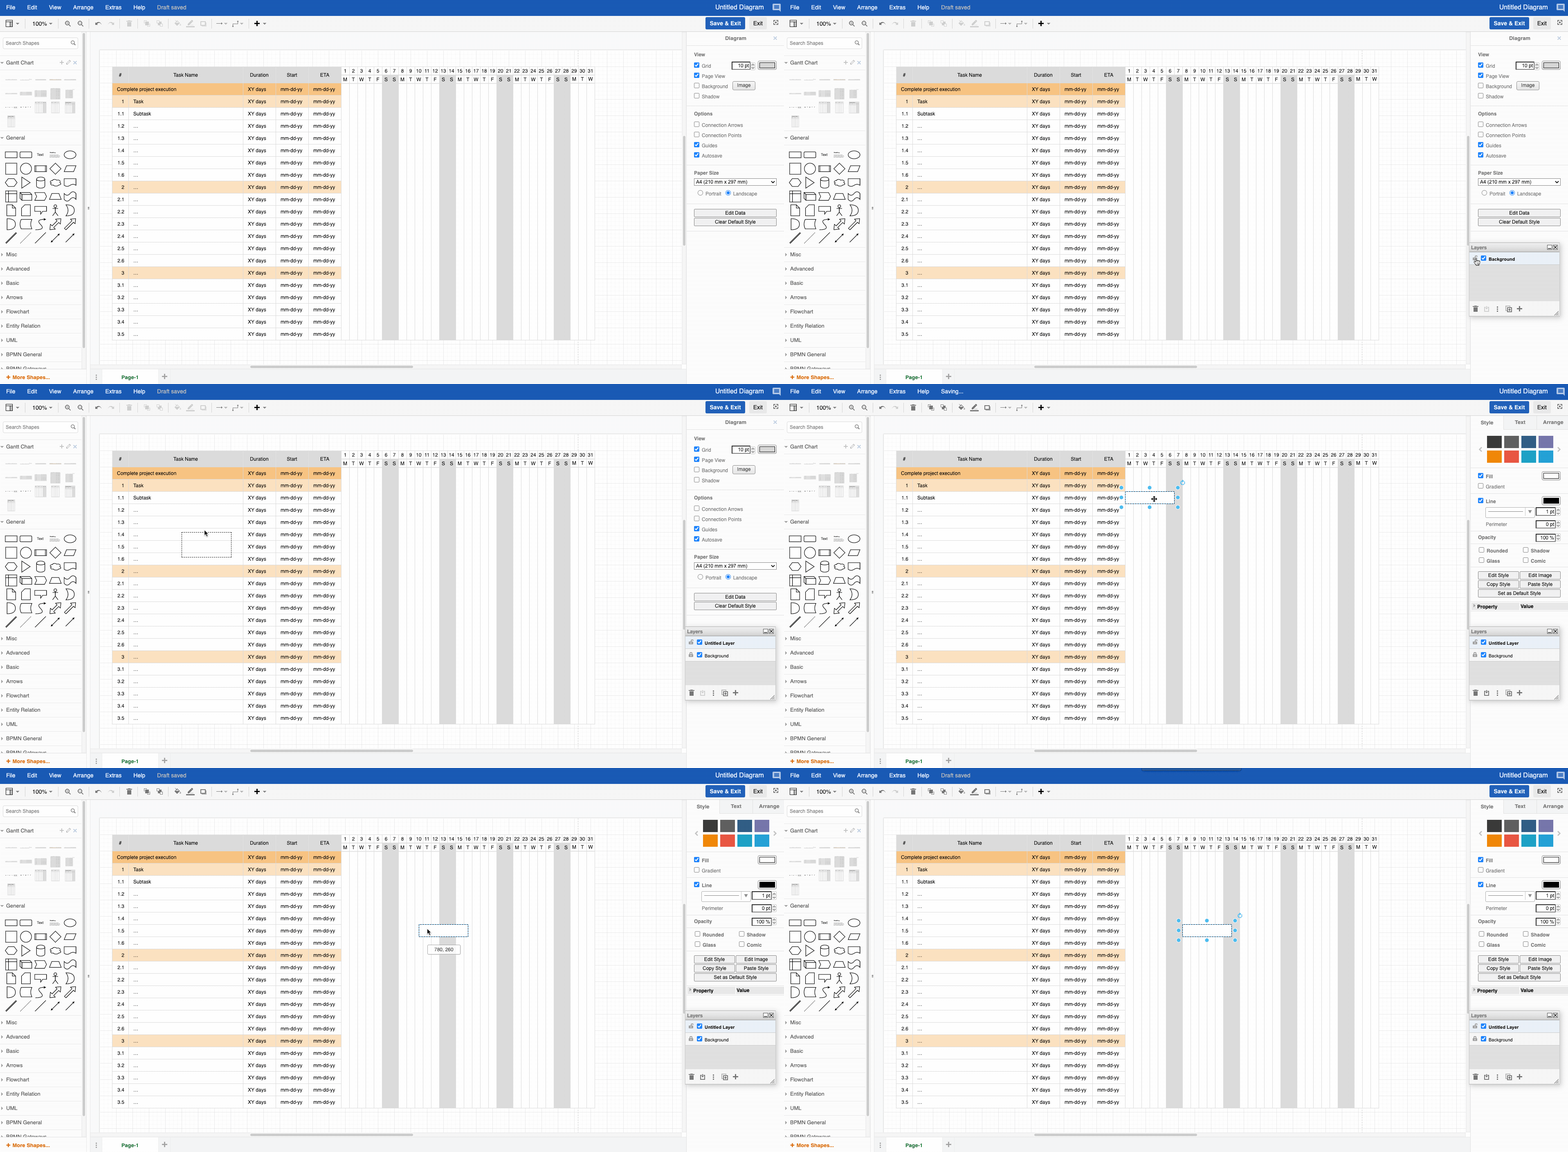
- In the menu, select view then layers
- Next to the background layer, click the padlock symbol to lock.
- Create a new layer for your status bars
You can now select the status bar shapes and move them around! To learn more about layers in draw.io, please check out our related step-by-step guide on layers. Or download our Interactive Guide on layers to learn by doing.
Custom Templates
You might have noticed when you went to create a new document that you could choose a Gantt chart template via the Tables category. This might be a good option for you if you’re not really familiar with what a Gantt chart looks like and just want to take a look at all the elements. However, we highly recommend starting with a blank canvas and use the shape library you imported.
You created this amazing new diagram where you’ve customized all the text, colors, and layout. Why not just create your own custom Gantt Chart template? You didn’t go through the whole process of setting all of this up just to click exit and never see it again, right? Creating a custom Gantt chart template in draw.io puts a lot of power and efficiency into your diagramming hands. It’s something you can keep using, again and again, requiring you only to adapt the text to suit your next project.
We wrote a whole post on how to set up your template so that each time you create a new diagram it appears in the dialog box along with the other templates. This template can also be made available to your team so that you can all collaborate. This gives all of you control over one chart that you can work on together and maintain an overview of how your project is going.
Defining your needs
We want to give you as many ways as possible to make draw.io your own. If you are unsure as to whether or not you should create a custom template or a custom library, we would say that it depends completely on your needs.
A custom template would be more useful if you have tasks and timelines that repeat at regular intervals. If your tasks are the same in May as it will be through to December, you would benefit more from creating a template. The next time you want to create a new diagram, your custom template will be ready to go via the template manager.
Do you only occasionally need a Gantt chart because you don’t have projects that repeat at regular intervals? Or perhaps you only need to create Gantt charts once in a while for a presentation or an information page. Then learning how to create a custom library with our step-by-step guide might be the better route for you. This gives you the opportunity to break out of a static template. Keep in mind that a custom library will then become available to everyone making it collaborative. They can do this by selecting + more shapes at the bottom of the shape library section and scroll down to custom libraries where you can activate the checkbox.
Now that you have the tools to create your very own Gantt chart with draw.io, we’re sure that you will find many more uses for one in the future. Already familiar with draw.io’s Gantt charts? Let us know how you use them. We love to hear from you so if you have any questions or comments, don’t hesitate to contact us. Until next time, happy diagramming!
¹ Marsh, E. R. (1976). The harmonogram: an overlooked method of scheduling work. Project Management Quarterly, 7(1), 21–25.
Last Updated on April 18, 2023 by Admin


