
What are Wardley Maps?
A Wardley Map is both diagram and methodology. Or, to put it another way, Wardley Mapping is an approach to business strategy, whereas a Wardley Map is a diagram created in Wardley Mapping to explore the competitive landscape.
The process of creating a Wardley Map helps to increase awareness of the strategic situation so that your actions can be more purposeful. It allows teams to assess the importance of features or products, evaluate decisions and avoid mistakes by looking at the full context.
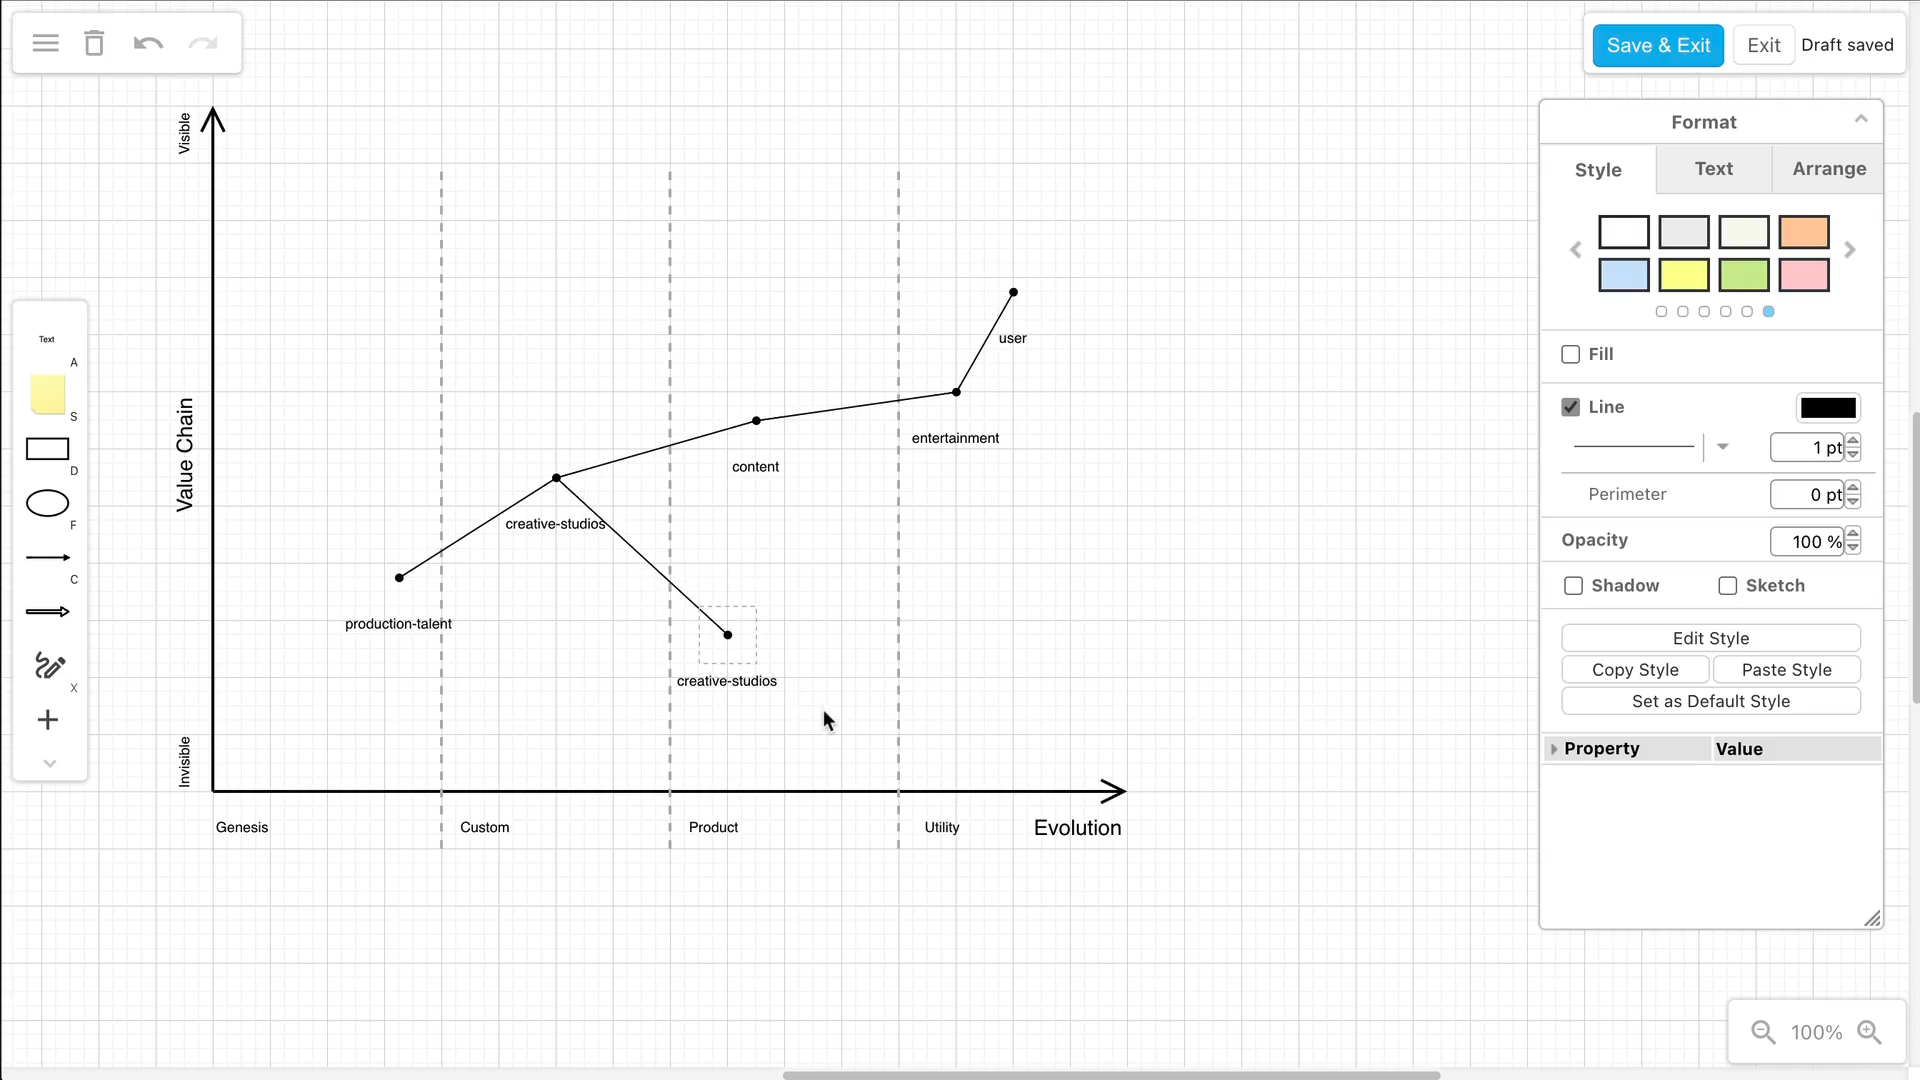
If you want to make your own Wardley Map in Confluence, draw.io gives you the tools you need to start mapping.
The Art of War-dley
Simon Wardley, the creator of Wardley Mapping, was inspired by Sun Tzu’s The Art of War, in which the ancient strategist lays out five factors of warfare. Wardley updated the list for the modern business environment:
Purpose – the “why” or moral imperative behind what you are doing
Landscape – a map of the competitive environment
Climate – the external forces acting on the environment
Doctrine – the training and standard ways of operating
Leadership – context dependent strategic decisions
The Wardley Map falls under the category of Landscape, as it’s designed to help you map out the competitive business environment. It can be used to analyze something as broad as an entire industry or narrowed down to just your company and suppliers.
There is plenty of material on each of the other factors if you want your Wardley Map to truly match the methodology. On the other hand, part of the methodology is to jump in and take it one step at a time, accepting that you will make mistakes and get better at mapping with practice. Don’t be afraid to dive in!
Building a Wardley Map
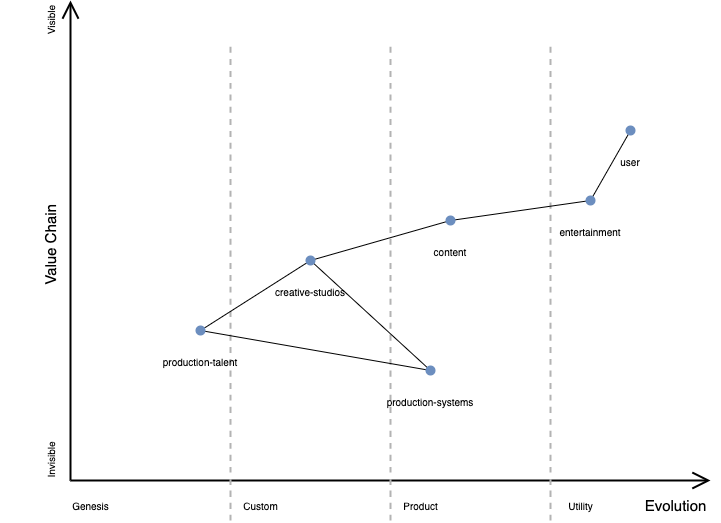
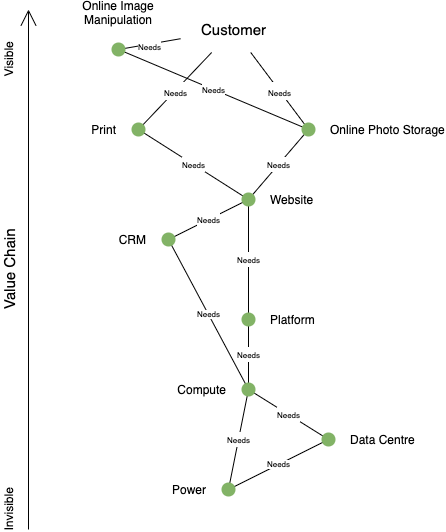
A Wardley Map is drawn along an x and y axis. The y or vertical axis represents a value chain, starting with your users at the top, followed by their needs. This is an opportunity to consider who your work benefits, who might be missing from your usual picture, and if they have needs that are not being met.
Next, you’ll list the capabilities of your product/service that meet those needs. For example, your user may have a need for online photo storage, which is met by your website. Your capabilities will have needs in turn – your website, for instance, will need a hosting platform - which will be met by yet another layer of capabilities, whether they come from your business or a supplier. Continue until you have a full picture of the system of needs and capabilities.
Once you have your value chain, it’s time to plot it across the x axis. This represents four stages of evolution for the capabilities: Genesis, Custom Built, Product/Rental and Commodity/Utility.
In the Genesis phase, capabilities are rare, poorly understood, and constantly changing. Over time, market forces like competition will move capabilities towards the right, in the direction of commodities/utilities, where they become common, well-defined and high volume. Think of the emergence of a new technology like the Cloud, and its evolution over the past decade. There are many other properties for each of the stages of evolution that can help you think about the development of your system.
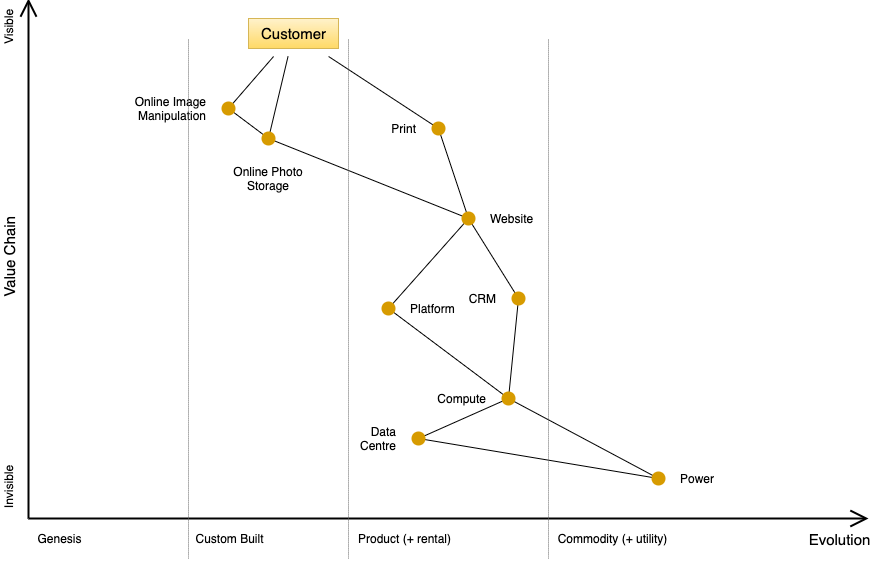
By plotting your value chain along these stages, you’ll be able to see those capabilities that need to be built from scratch or require special attention and avoid rebuilding something which can be outsourced. You may also find new opportunities in unmet needs, and places where the chain fails to deliver value.
With your Wardley Map complete you’ll have a fuller picture of your users, their needs, and the system of capabilities that serve those needs.
Creating your Wardley Map in Confluence with draw.io
The process of creating a Wardley Map is meant to be ongoing and collaborative, something that you discuss and refine together with your team. draw.io’s whiteboard mode is perfect for this kind of brainstorming session, and allows multiple users to work on one diagram at the same time.
Iteration is an essential part of Wardley Mapping. With your diagram saved in Confluence, you can return to it again and again, making changes as the situation, and your understanding, evolves. Layers allow you to separate permanent elements, like the axes, from those that you will be updating over time.
With Wardley Mapping’s visual approach to strategy you can communicate your business environment to your team and make decisions with clarity and purpose. You can learn more about Wardley Mapping at learnwardleymapping.com, and visit the Atlassian Marketplace to start mapping in Confluence with draw.io.
Last Updated on November 24, 2022 by Admin