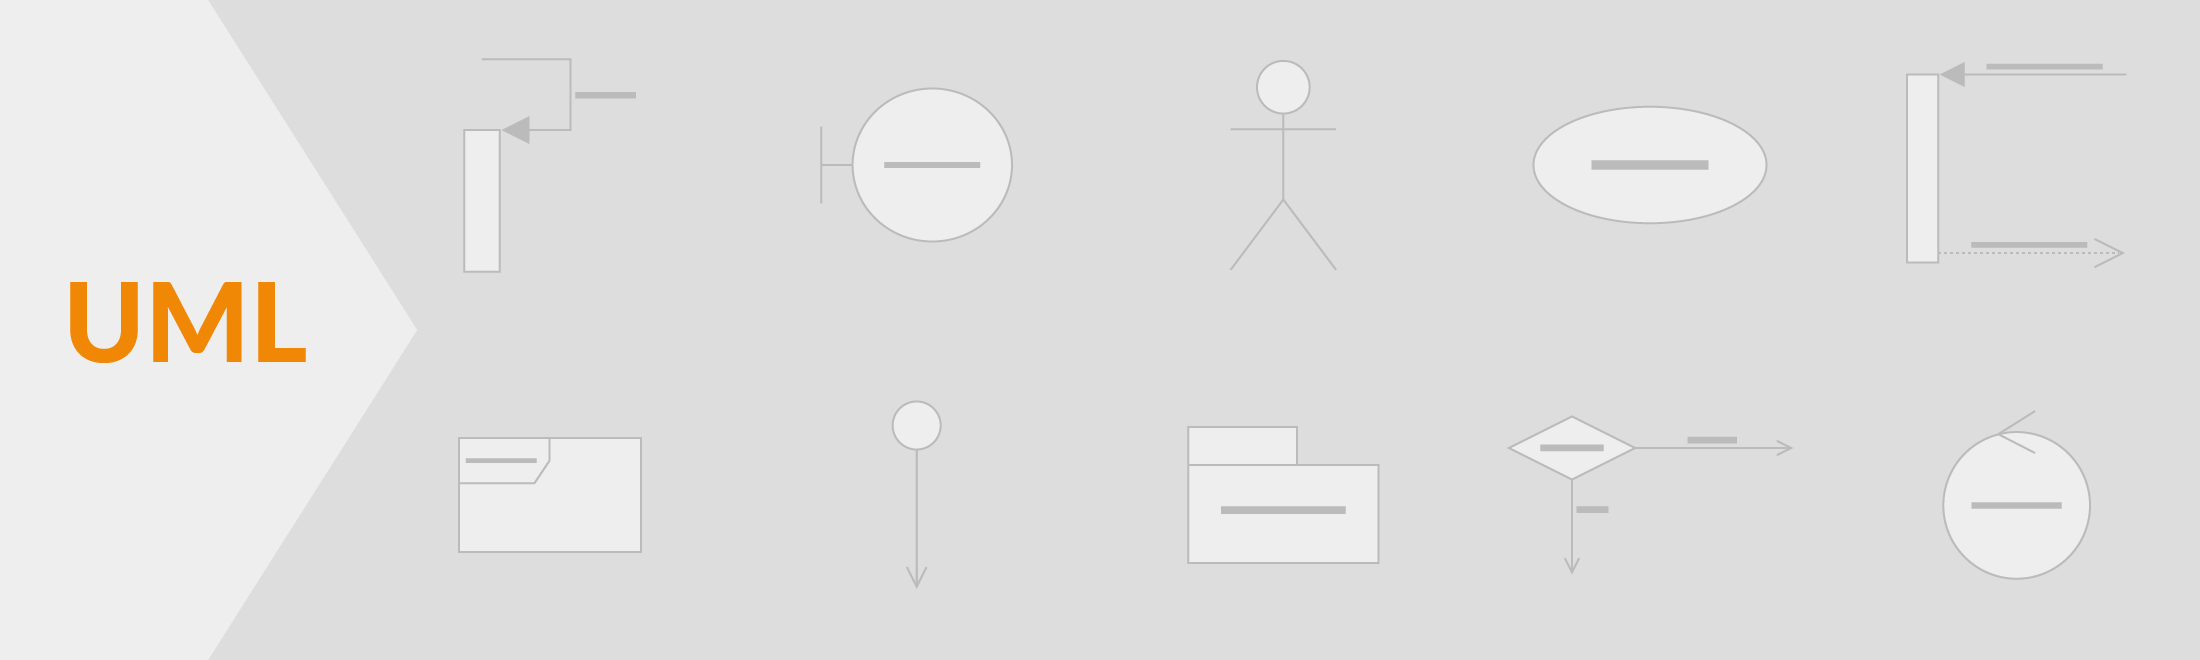
The Unified Modeling Language (UML) is a diagramming notation (language) that lets you visualize systems and software. It’s one of the most popular forms of diagramming in software development and became an ISO standard in 1997. Since then, there have been a few updates to add extra UML diagram types and to support new technologies in programming.
Diagrams are easier and faster to understand than text, so they are more appropriate to document systems than comments in millions of lines of code, although these are also important! They help you and your companies in many situations, like when you …
- onboard new colleagues or team members
- debug to find problems
- plan for new developments or processes
- optimize existing systems and programs
- audit your processes and apply for accreditations
And of course, when you want to develop something new – you will find many problems beforehand in your UML diagrams that could become showstoppers during development or quality testing.
There are two main categories and 14 different types of UML diagrams, each of which is used in a different situation.
- Structure diagrams: show the static relationships between the components in the system.
- Behavior diagrams: show how the components in the system react to each other, they capture how the system changes, and in some diagrams, how it changes over time.
Types of UML Diagrams

The different UML diagrams
There are a few UML diagrams that are used in most situations in software development or systems modeling, including IT infrastructure and business systems. The top three UML diagrams that you should get comfortable with include use case diagrams, class diagrams (if you are a programmer), and sequence diagrams.
Use case diagrams
Use case diagrams are created when you are looking at the requirements of your system or program.
They represent the functions or features, the actors and how these relate to each other (their relationships).
Class diagrams
Object oriented programming languages are based on classes and the relationships between them. UML class diagram notation was developed to represent these programs visually.
Classes contain their attributes (their data) and behaviors (member functions), and are related to each other with a variety of connectors.
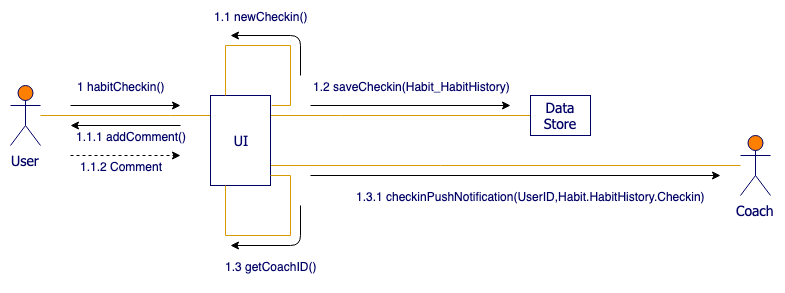
Sequence diagrams
Sequence diagrams are used to visualize both interactions within programs, business processes and IT infrastructures. They describe the sequence of interactions (messages) between actors and objects (things like databases or external interfaces).

Activity diagrams
Activity diagrams model the behavior of users and systems as they follow a process. They are a type of flow chart or workflow, but they use slightly different shapes.
State diagrams
State diagrams have been used in programming to describe the various states that a system can be in for decades. They aren’t limited to programming – every system and process has states. These diagrams are faster to create than activity or sequence diagrams, but show less information.
State diagrams show which states lead to each other, and what triggers a change of state.
Interaction overview diagrams
These UML diagrams are a combination of an activity diagram and sequence diagrams, where each individual activity is placed in its own frame, so it is easier to program.
Communication diagrams
These used to be called collaboration diagrams. They are similar to use case diagrams, detailing the information that is transferred. However, sequence diagrams are more often used to visualize the communication between objects as they are clearer and have a richer notation.
Additional UML diagrams for complex, large or specific systems
The remaining eight types of UML diagrams are used in specific circumstances, most commonly when you are working with extremely large systems with a great number of components.
Timing diagrams
This is a special type of sequence diagram that follows the behavior of objects over time. They are used more commonly when designing embedded systems, like programming control software for a washing machine.
Object diagrams
Object diagrams in UML are a specialized form of class diagrams. They visualize the more abstract class diagrams as if they have been instantiated and help software developers check whether their abstract structures will work in practice.
Component diagrams
A component diagram shows how the various components in a complex software system relate to each other and communicate using interfaces. They aren’t used for simpler or straight-forward systems.
Deployment diagrams
This is another specialized diagram for large and complex systems where software is deployed over multiple systems. These days, web services like Amazon Web Services (AWS) and Google Cloud Platform (GCP) have their own notations – you can find these shapes in their draw.io shape libraries.
Package diagrams
Package diagrams show the dependencies in your system, and are used predominantly when you have a large codebase. Packages may contain use case diagrams to illustrate functionality of the system, and can visualize the layered architecture within a software system.
Composite structure diagrams
Where you have a complex software system with many different use cases, UML composite structure diagrams visualize what actually happens when the program is run. It represents the internal structure of a class and how it relates to different class components.
Profile diagrams
With a profile diagram, you can extend and customize UML to be used in a particular domain (e.g., aerospace, healthcare, financial) or platform (J2EE, .NET) with stereotypes, tagged values and constraints. Again, this type of diagram is usually used to model extremely large and complex systems.
Creating UML diagrams in draw.io
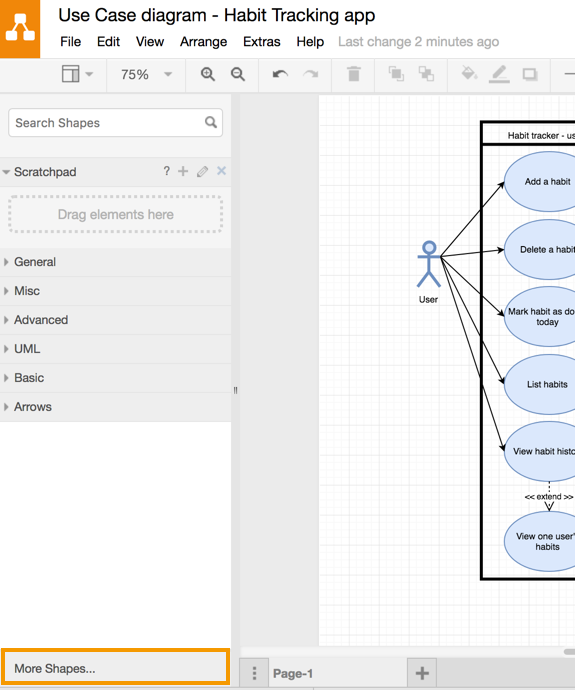
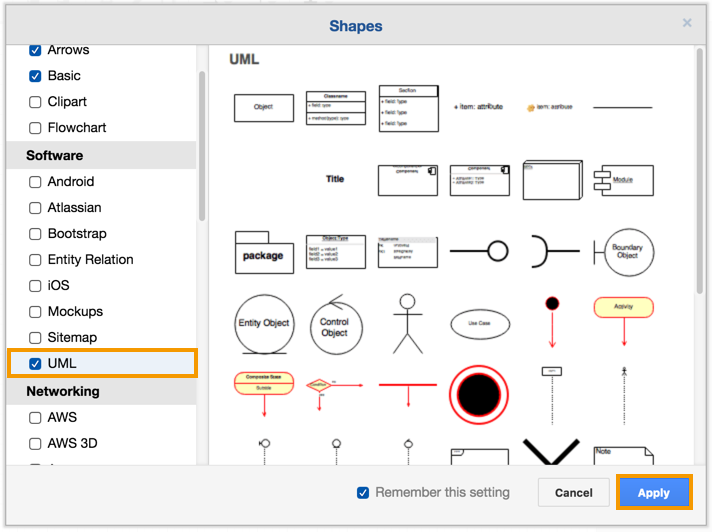
The UML shape libraries let you diagram your systems and software quickly and easily using the UML notation. Make sure you enable this library before you start diagramming: Click More Shapes … at the bottom of the left-hand panel, then enable the UML shape library and click Apply.
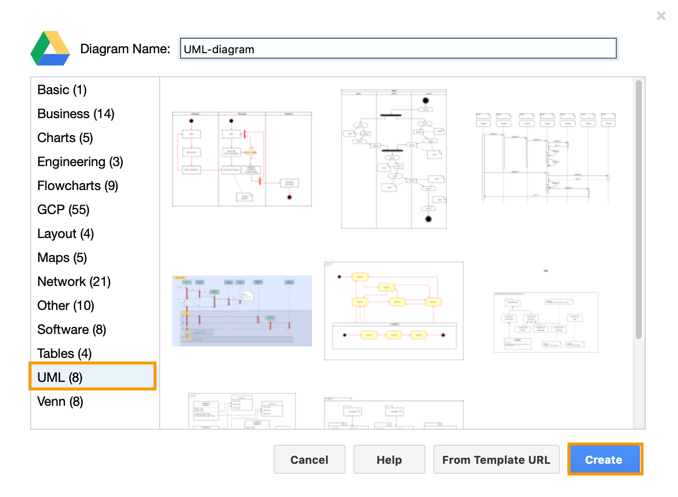
You can also get a head start by using any of the UML templates when you create a new diagram. Select UML from the list of template libraries on the left, click on the diagram template you want to use, then click Create.
Tip: If you hover your mouse over a diagram template, you’ll see the name of the file which will tell you what type of UML diagram it is.
Need help getting started with draw.io?
If you haven’t used draw.io before, or if you are new to diagramming, have a look at our getting started tutorial. It’s packed with explanatory videos so you’ll never get lost.
We also provide a self-directed practical training course that you can step through and a growing library of training material.
Want to hear how others are using draw.io? Read about how Solution Architect, Marcel Grossert, uses draw.io to visualize his workflows!
Last Updated on October 1, 2020 by Admin