UML sequence diagrams are the first highly detailed behavioural diagrams that you will create when using UML for software development. They aren’t so often used in business process modelling, especially because they refer to the actual data and operation names that will be used when programming. That doesn’t mean you can’t use sequence diagrams: they can be used to model business objects and their interactions in detail, or by IT staff to detail how the elements in their infrastructure communicate and work together.
Note: UML 2.0 is more detailed and specific than the sequence diagrams created using the earlier version of UML, making it easier to write programs directly from the diagrams.
Create your class diagrams first.
It’s easier to create sequence diagrams after you have already created your class diagrams (a structural diagram detailing the data structures and their operations).
You’ll find you will almost always have to go back and modify your earlier diagrams because the data structures won’t work the way the sequence needs to be implemented.
Or if you’re like me, you’ve forgotten a bunch of variables and methods!
Why should we do a sequence diagram after we modeled behaviour in an activity diagram?
They are both behavioural diagrams in that they model the steps in a process. Activity diagrams are quicker to create and at more of a ‘high level’ – they show you the information flow, but not when or in what order the information flows.
Sequence diagrams take the classes with their data and operations, plus the general behavior modeled in the activity diagrams, and show how it all fits together. Apart from parts of the actual interface, you could write your program from the combination of the class and sequence diagrams!
Creating UML sequence diagrams in draw.io
As usual, make sure you’ve enabled the UML shape library. If you don’t see it, at the bottom of the sidebar, click on More shapes…, select UML from the list on the left, and click Apply.
There’s quite some special notation used in sequence diagrams. I’ll explain the most common elements and use the Habit Tracker app to show you how they work. You might want to review the Habit Tracker app’s diagrams from earlier posts to see the diagramming process:
Start with the lifelines
Lifelines are used to represent the actors and systems in your program. There are four different types you can use in draw.io, or five if you count the simple rectangle that is often used in sequence diagrams.
- Actor – a stick figure, often representing a person or a use case.
- Control – a circle with an arrow-outline. Controls organize and schedule the interactions.
- Entity – a circle balancing on a line. Typically used for interfaces, or interactions with external systems and services.
- Boundary – a circle with a vertical line to the left of it, like a stop sign on its side. Usually used for systems that don’t do any processing or steps themselves, like databases.
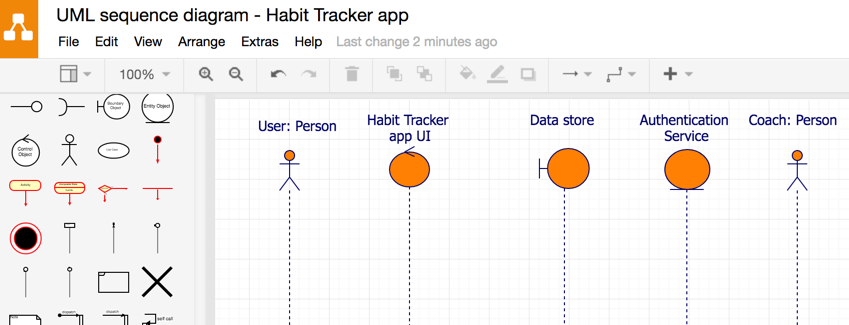
Tip: Sequence diagrams can get long and complex, very quickly. Keep these lifelines available on a separate page in your diagram so you can copy and paste them when you want to create a sub-sequence diagram.
Also, if you have accidentally used the wrong symbol, as you can see I did in the next couple of screenshots, you can easily replace shapes in draw.io!
Represent the time needed to complete an operation or set of operations
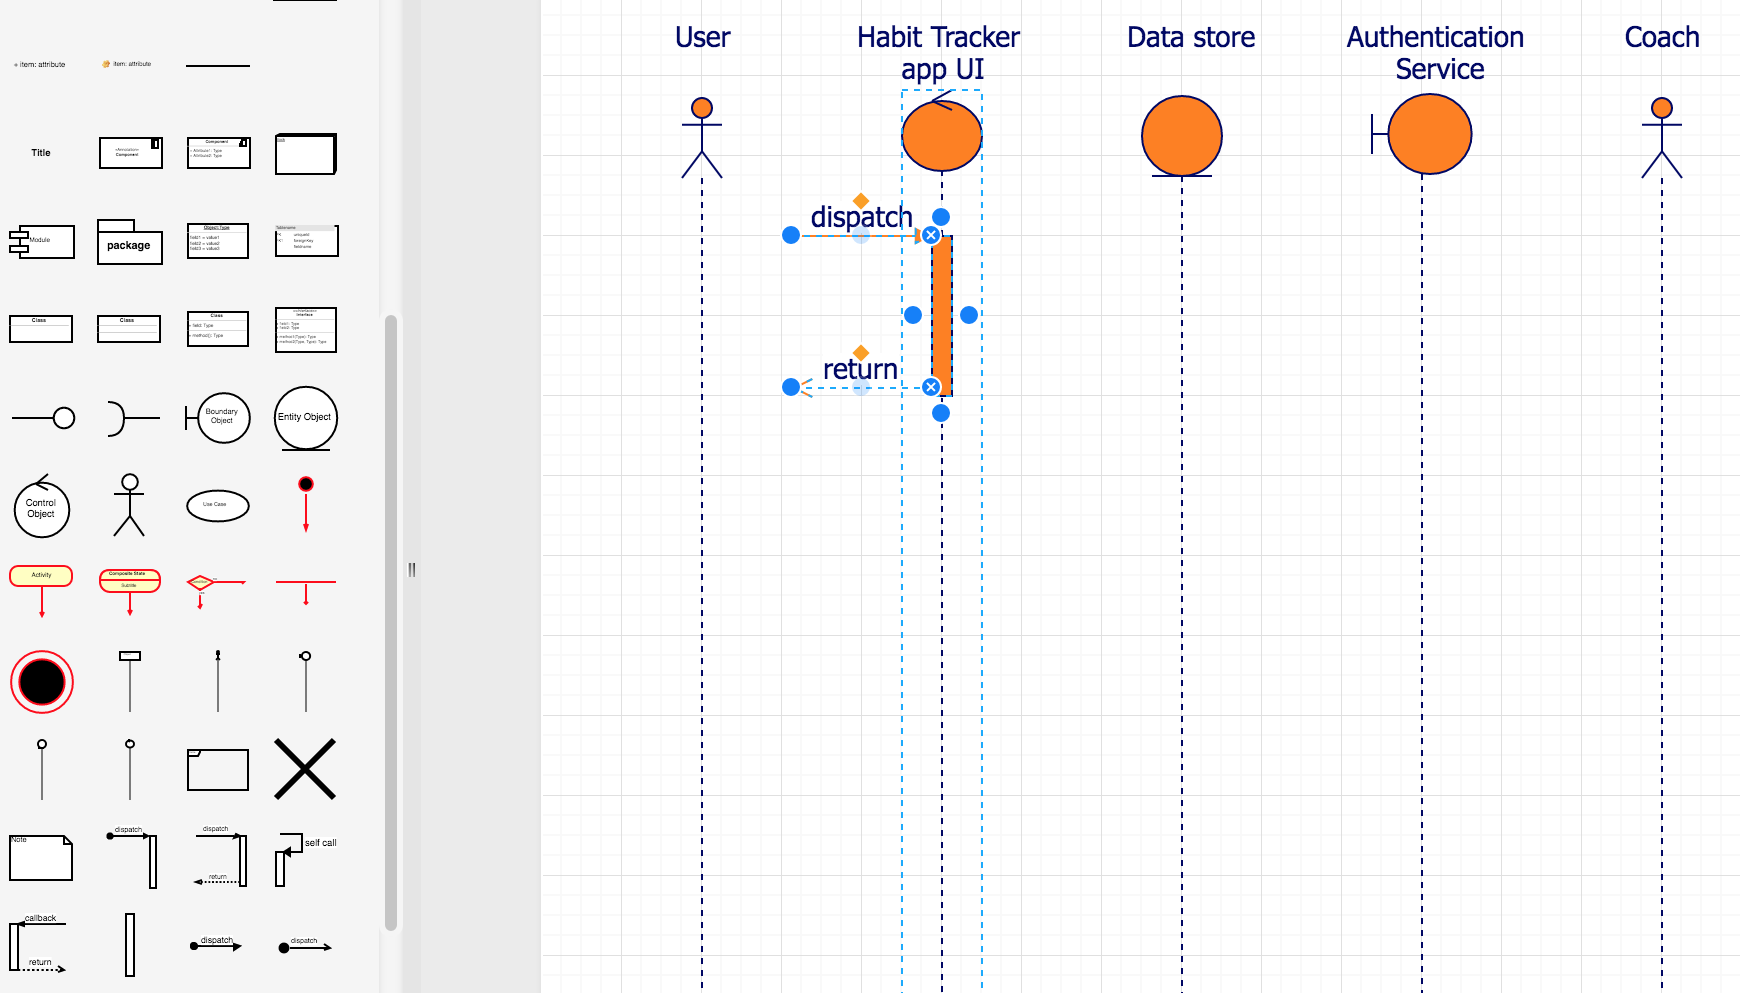
A rectangular activation box is placed over the lifeline (or on top of another activation box) to indicate when and how long something is being done.
To add an activation box in draw.io, drag it from the shape library and drop it onto the lifeline. You can then drag it up and down, or resize it to indicate a longer task.
You’ll often find that one lifeline, typically the control lifelines, will have one large activation box. You’ll need to keep resizing it (larger!) as you step through and add more steps to the sequence.
Flow of data and control
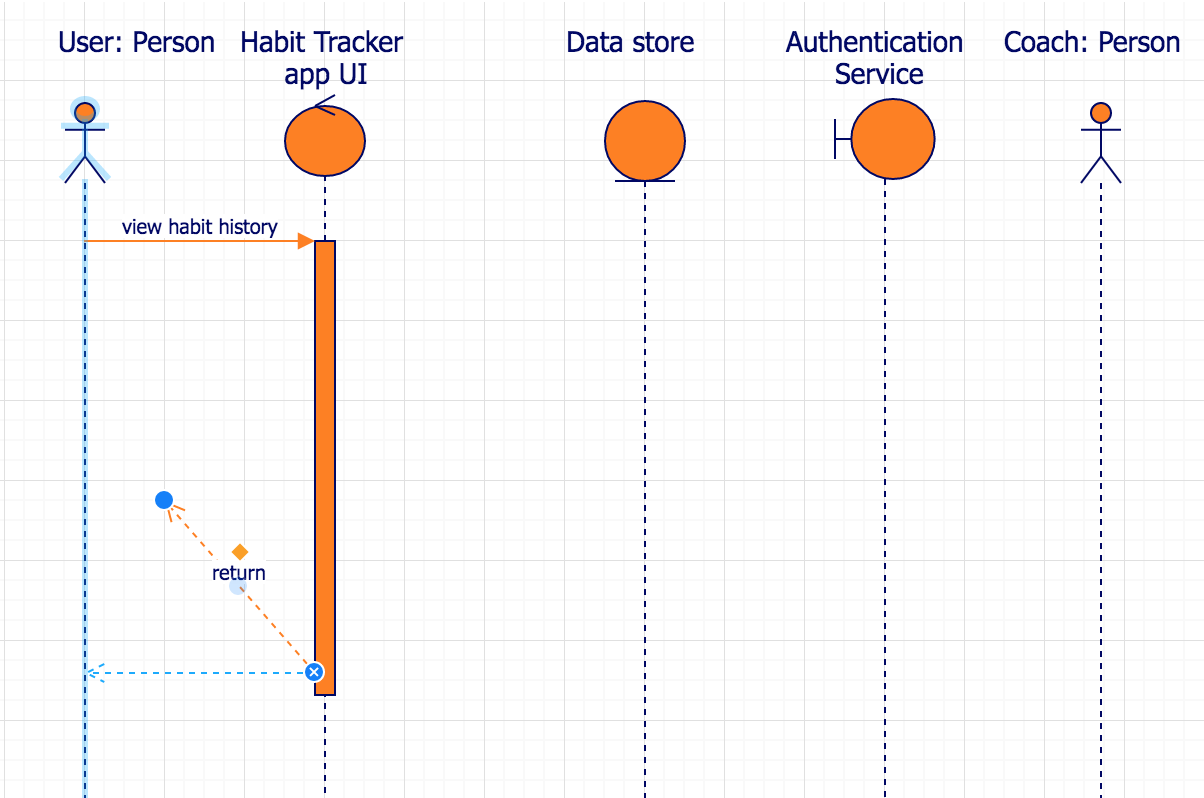
There are almost always arrows going to and from an activation box to indicate the flow of information (and process/control). Drag the end of a connector and hover over the lifeline until it turns blue. It will then snap to the position that represents either the top of bottom of the activation box, depending on which connector you are attaching. A solid connector indicates a request for information or a function call, a dotted line a return, with or without a value.
Add the operation name, parameter names and return value names as labels on the connectors, just as you have defined them in the class diagram.
Frames for a set of actions or fragment of your sequence
Add to your sequence diagrams by adding more activation boxes, attaching the connectors to the lifelines (or other activation boxes) and adding the operation, parameter and return value names for each step.
You’ll quickly come across an operation that requires something a little more complex. Like a loop!
Frames can be used to indicate sets of operations, and indicating what type it is with the text in the top left.
- loop for repeated steps.
- alt for alternative steps, with as many alternative paths as you need (not just if-then-else!)
- opt or option for steps that are only performed if they meet a certain condition
- break that will exit the loop or the action if a certain condition is met.
Add the condition inside the frame next to the frame type at the top left. The frame should completely surround all of the steps needed to complete that ‘fragment’ of the sequence.

You can represent even more complex processes using frames, including parallel actions – those occurring at the same time as each other in a sequence (with par). For a more in-depth tutorial of when and how to use each sequence diagram element, please see this excellent tutorial from IBM.
In the partial diagram below, the Habit Tracker UI saves the checkin data to the database (Data Store) and at the same time, sends a notification to the coach that one of their users has checked in.
Tip: When you need to indicate parallel or alternative paths, use the dotted line from the General shape library, and attach both ends to the inside of the frame.

Sub-sequence diagrams
Because these diagrams are so large and complex, but neatly broken into smaller action sets, you can take full advantage of draw.io’s multi-page diagram and linking features.
- Add a new page and rename it to something appropriate. See how to work with multi-page diagrams here.
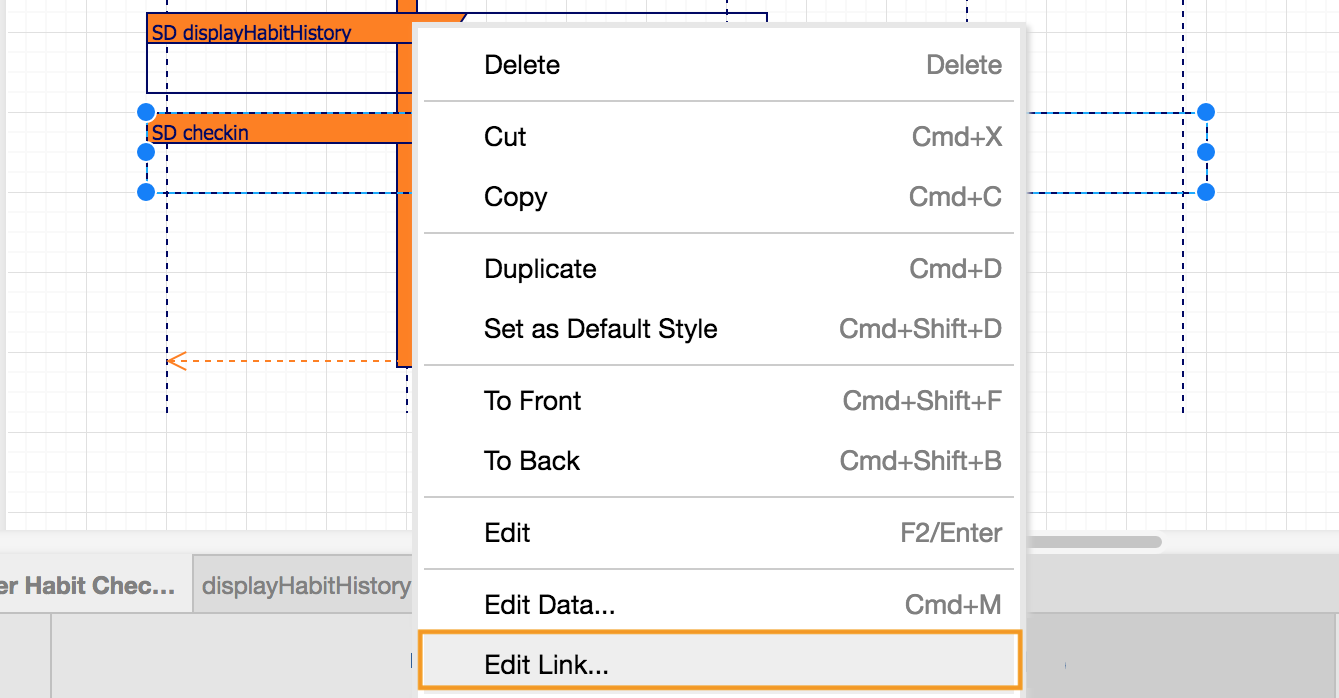
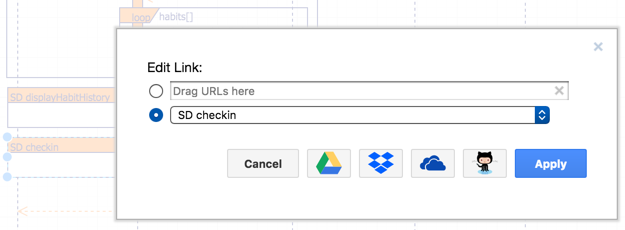
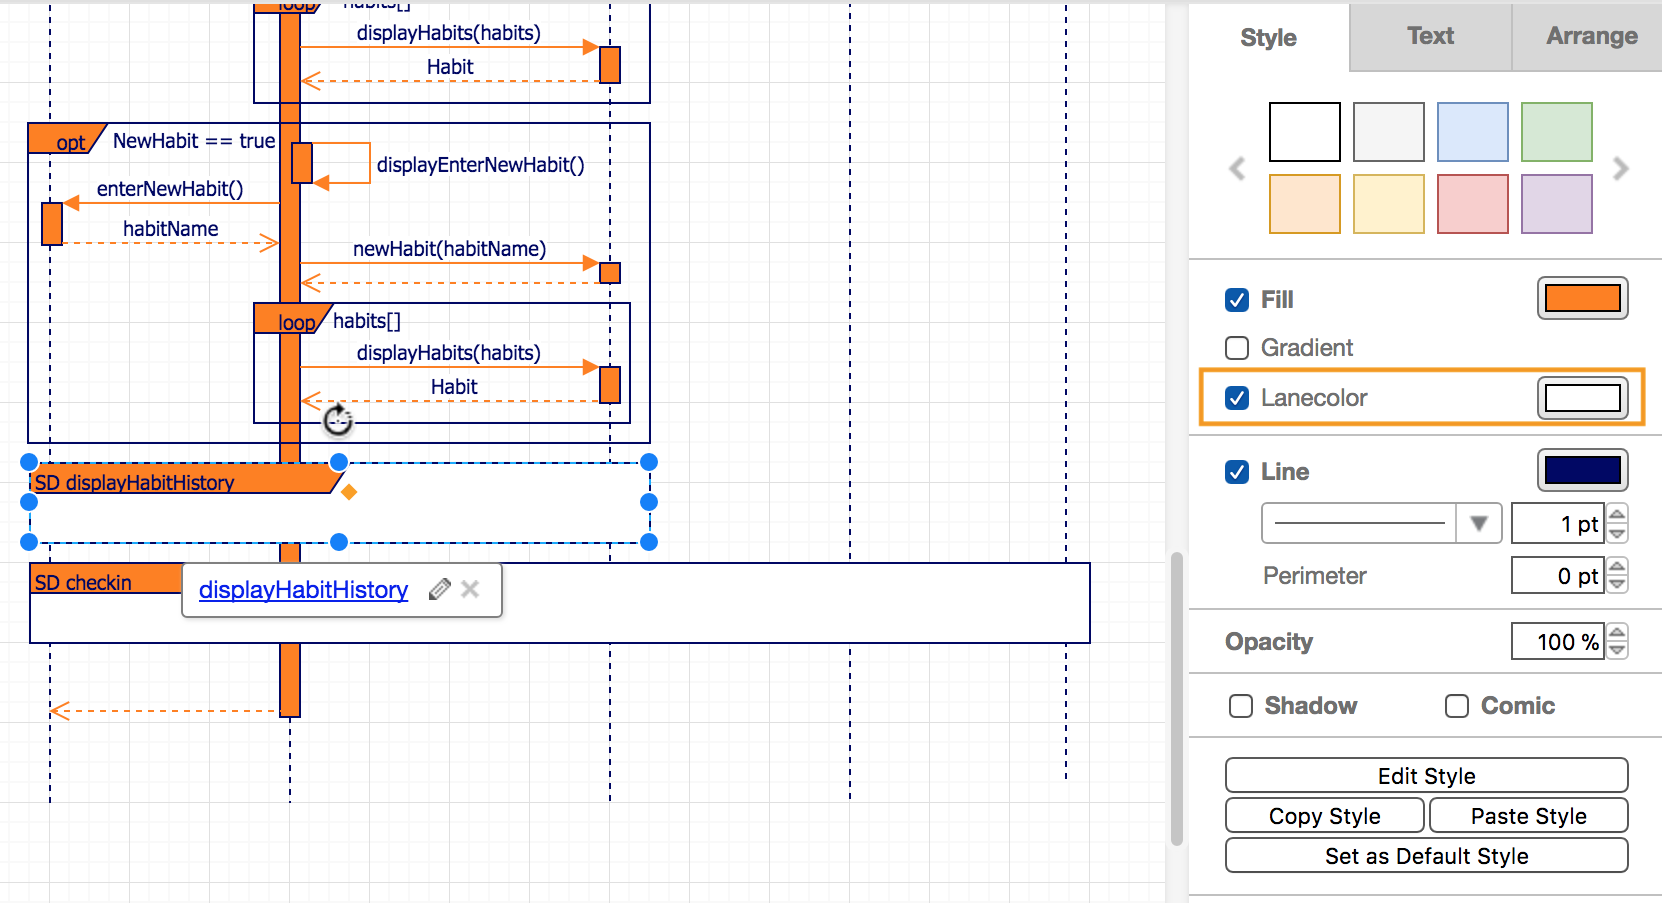
- Add a frame and link it to the new page – right click on the frame, click Edit Link, and select the page from the drop down list, then click Apply.
- Then set the background of the frame (not the type area), the lanecolor in the format panel, to an opaque color to make it stand out that this is a sub-diagram – you don’t want to be able to see the lifelines under the frame.
Putting it all together – the sequence diagram
So, what does the Habit Tracker app’s sequence diagram look like? Here’s the main diagram, with two linked sub-sequence diagrams on other pages in the diagram, and a page with just the lifelines for ease of copying. You can open this diagram in draw.io and see how it works across multiple pages.
Keep requirements documents and diagrams together
If you are using Jira or Trello for software development, you can collaborate on requirements and diagrams directly within their related tasks. draw.io is available as a Jira app and a Trello Power-Up saving you the overhead and hassle of shuffling diagrams around via email, attaching an endless number of versions of the files to the tickets, or using a shared file system.
Need some help?
What UML diagrams should you have done, at least partially, before working on your sequence diagrams?
Did you know you can also use draw.io to mockup your mobile apps?
If this is your first time using a diagramming tool, take a look at this self-directed training course which will help you learn about draw.io’s many features. Want to hear how others are using draw.io? Read about how Solution Architect, Marcel Grossert, uses draw.io to visualize his workflows!
Last Updated on October 1, 2020 by Admin

