
Flowcharts, data flow diagrams, workflows, process diagrams, activity diagrams, process maps: No matter what you call them, you have most likely used them! Flow charts are the most common diagram type that is used in all industries and across all departments to clearly visualize the steps in any process.
They can be used to plan new processes, optimize existing processes, document software programs in development, explain processes simply to onboard new team members, plan project milestones, and more. Flowcharts are also commonly used as checklists, and may be audited to ensure a company is following their documented processes reliably for certification requirements (ISO, SOX, etc.)
Some departments may use specialized types of process diagrams, like BPMN diagrams or UML activity diagrams. But most people use easily recognizable shapes and simple rules to create their flowcharts.
Flowcharts use basic shapes like rectangles, diamonds and circles to indicate the different steps, interactions and decisions in a process, linked together with arrows (connectors) to show the direction between steps. More complex procedures may be split over multiple pages.
Flowcharts in draw.io
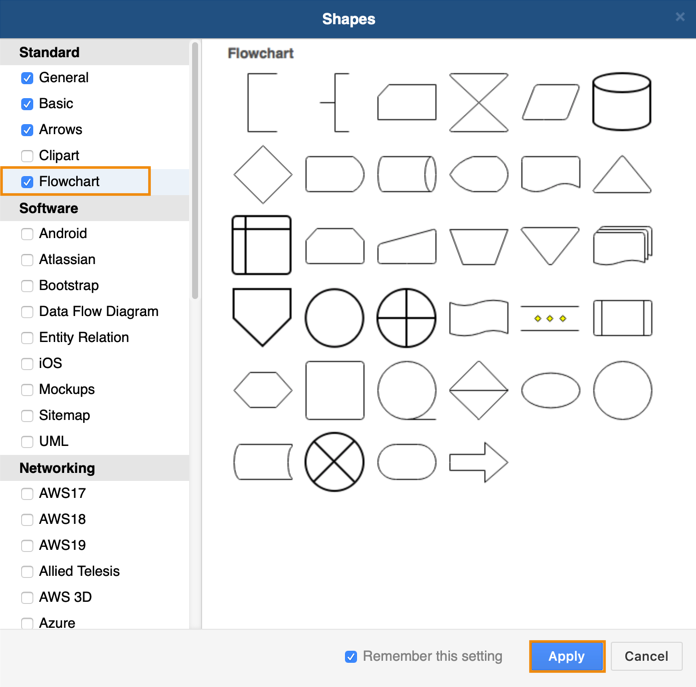
The Flowcharts shape library should be enabled by default. But if you don’t see it, you’ll need to enable it to get to the additional flowchart shapes.
- Click More shapes at the bottom of the left-hand panel.
- Enable the checkbox next to Flowcharts, then click Apply.
You’ll now see the shape library available in the left hand panel.
If you aren’t sure which shape you should use, hover over one and you’ll see its name.

Flowchart templates in draw.io
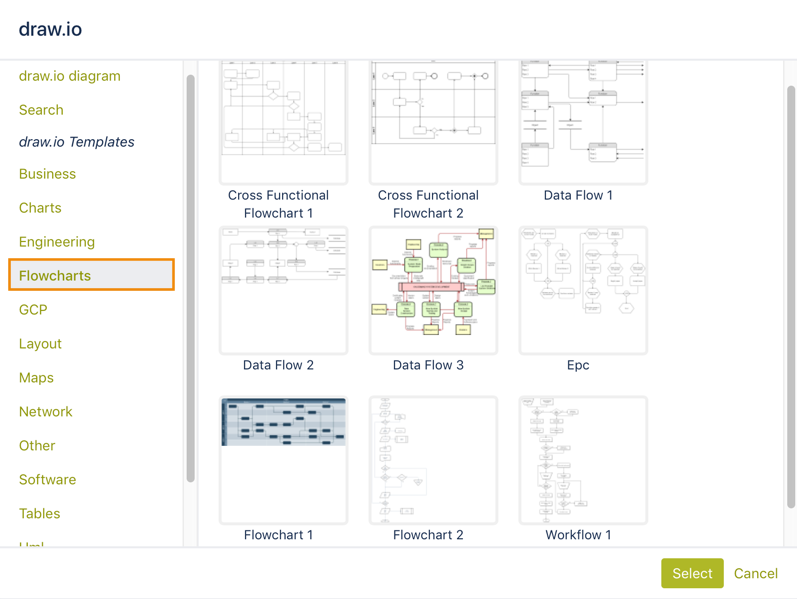
draw.io has a number of templates you can use for various types of flow diagrams. You can use these as examples to see what is possible, or modify one to match your process.
- When you start a new diagram in draw.io, select Flowcharts from the template library.
- Hover over one of the templates to see its name.
- Click on one of them, then click Select to open it.
Most people choose to build their own simple flowcharts from scratch though!
Create a simple flowchart
Let’s look at a simple example of a flowchart. I needed to document the process of translating a single blog post for a new translation team member recently – it was much easier to do this using a flow chart than with a page full of text and screenshots.
Rounded rectangle – a step in the process. Green to indicate the start, red to indicate the end. I made the two ‘sub-processes’ orange and yellow to make them stand out a bit, as previous team members had trouble with these steps.
Diamond – a decision point. The labels on the connectors coming out of the diamond indicate the decision taken.
Of course, these aren’t the only shapes that you can use in a flow diagram, but they are the most basic building blocks!
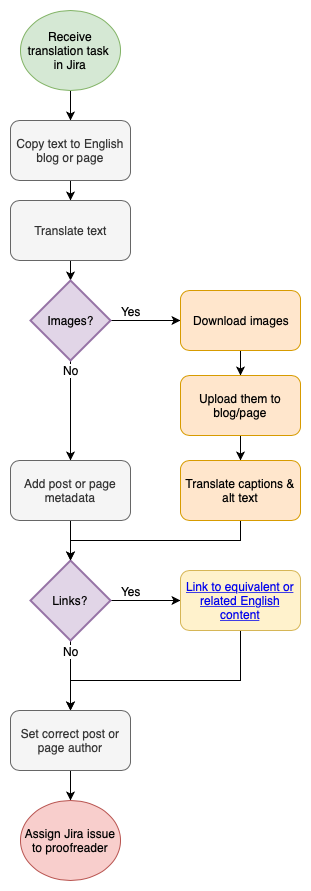
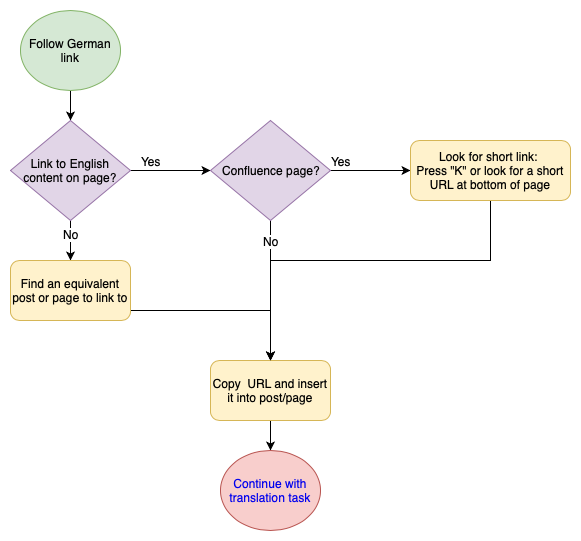
Page 1 and 2 of the blog post translation flowchart – viewers can jump between the pages by clicking on the linked shapes.
Quickly create a flowchart in draw.io
You can add each shape from the shape library to the drawing area as you need them, and draw the connections between them. Or you can speed up your diagramming by using some of these time-saving tips.
1. Clone and connect shapes automatically
Personally, I prefer to get the flowchart on the page quickly using a single shape – in this case the rounded rectangle – and add all the steps by cloning the shape and connecting them automatically:
- Place the first shape on the drawing area, hover over it, then click on the blue arrows to add and link another shape quickly.
- Just start typing or double click in the shape to add/edit the text.
- Double click on a connector to add a label.
I then add colors using the format panel to make it clear which of shapes I need to replace.

2. Add missing connectors
Hover over a shape until the blue arrows and/or connection points (‘x’ in a green circle) appear. Click and drag the connector from these points to the target shape. You can connect this as a floating or fixed connection.
In the example, I’ve drawn the connector from a fixed point (‘x’ in a green circle) and connected it to the target shape as a floating connector (blue border).

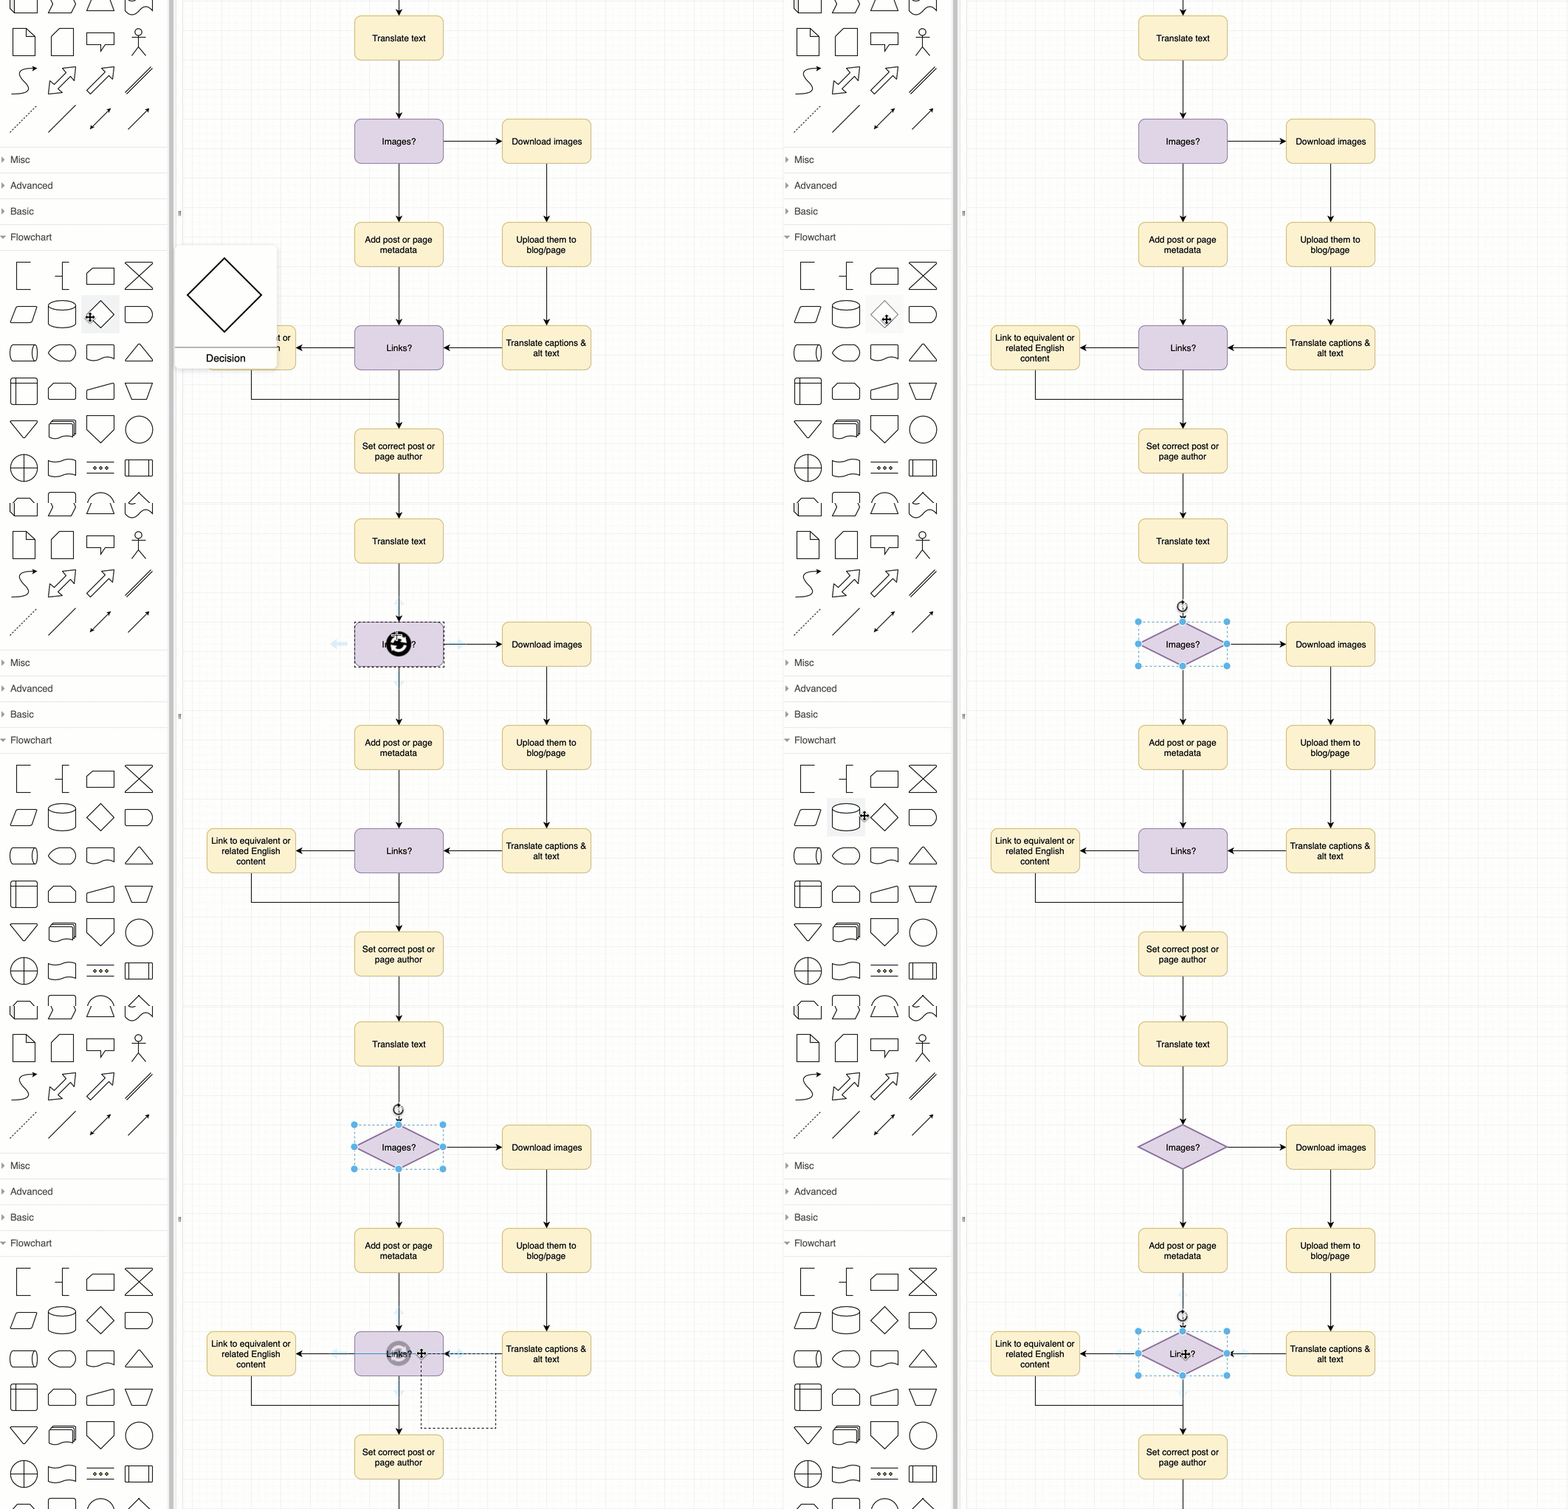
3. Replace shapes
To replace a shape, drag the shape you want to replace it with from the shape library on the left and hover it over the shape on the drawing area until the black ‘replace’ circular arrow appears. Then drop the new shape.
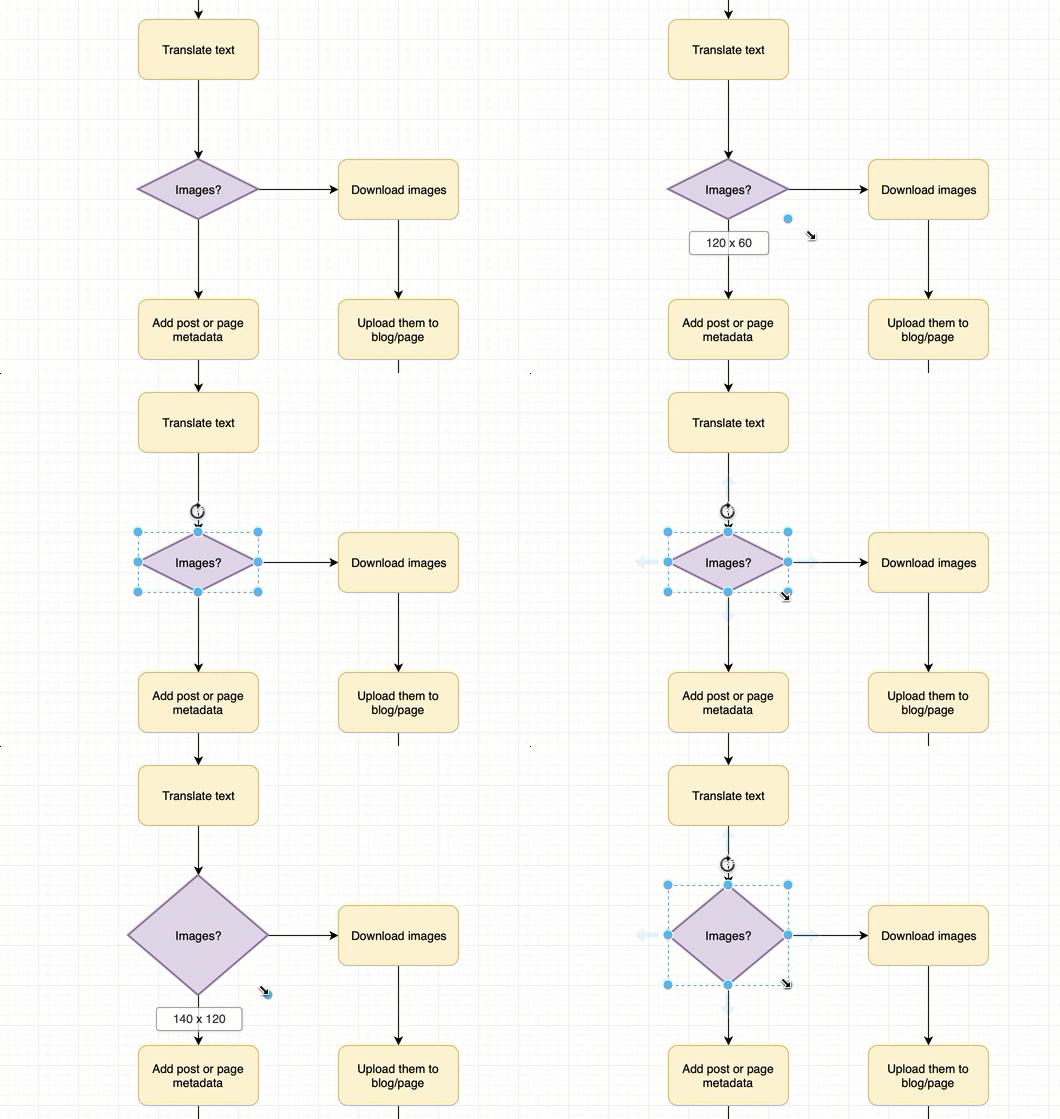
4. Resize shapes and keep them centered
It’s annoying to always move shapes around after you resize them, just to make sure the connectors are straight. But, if you click and drag to resize the shape while holding down the Control key, the shape will stay centered!
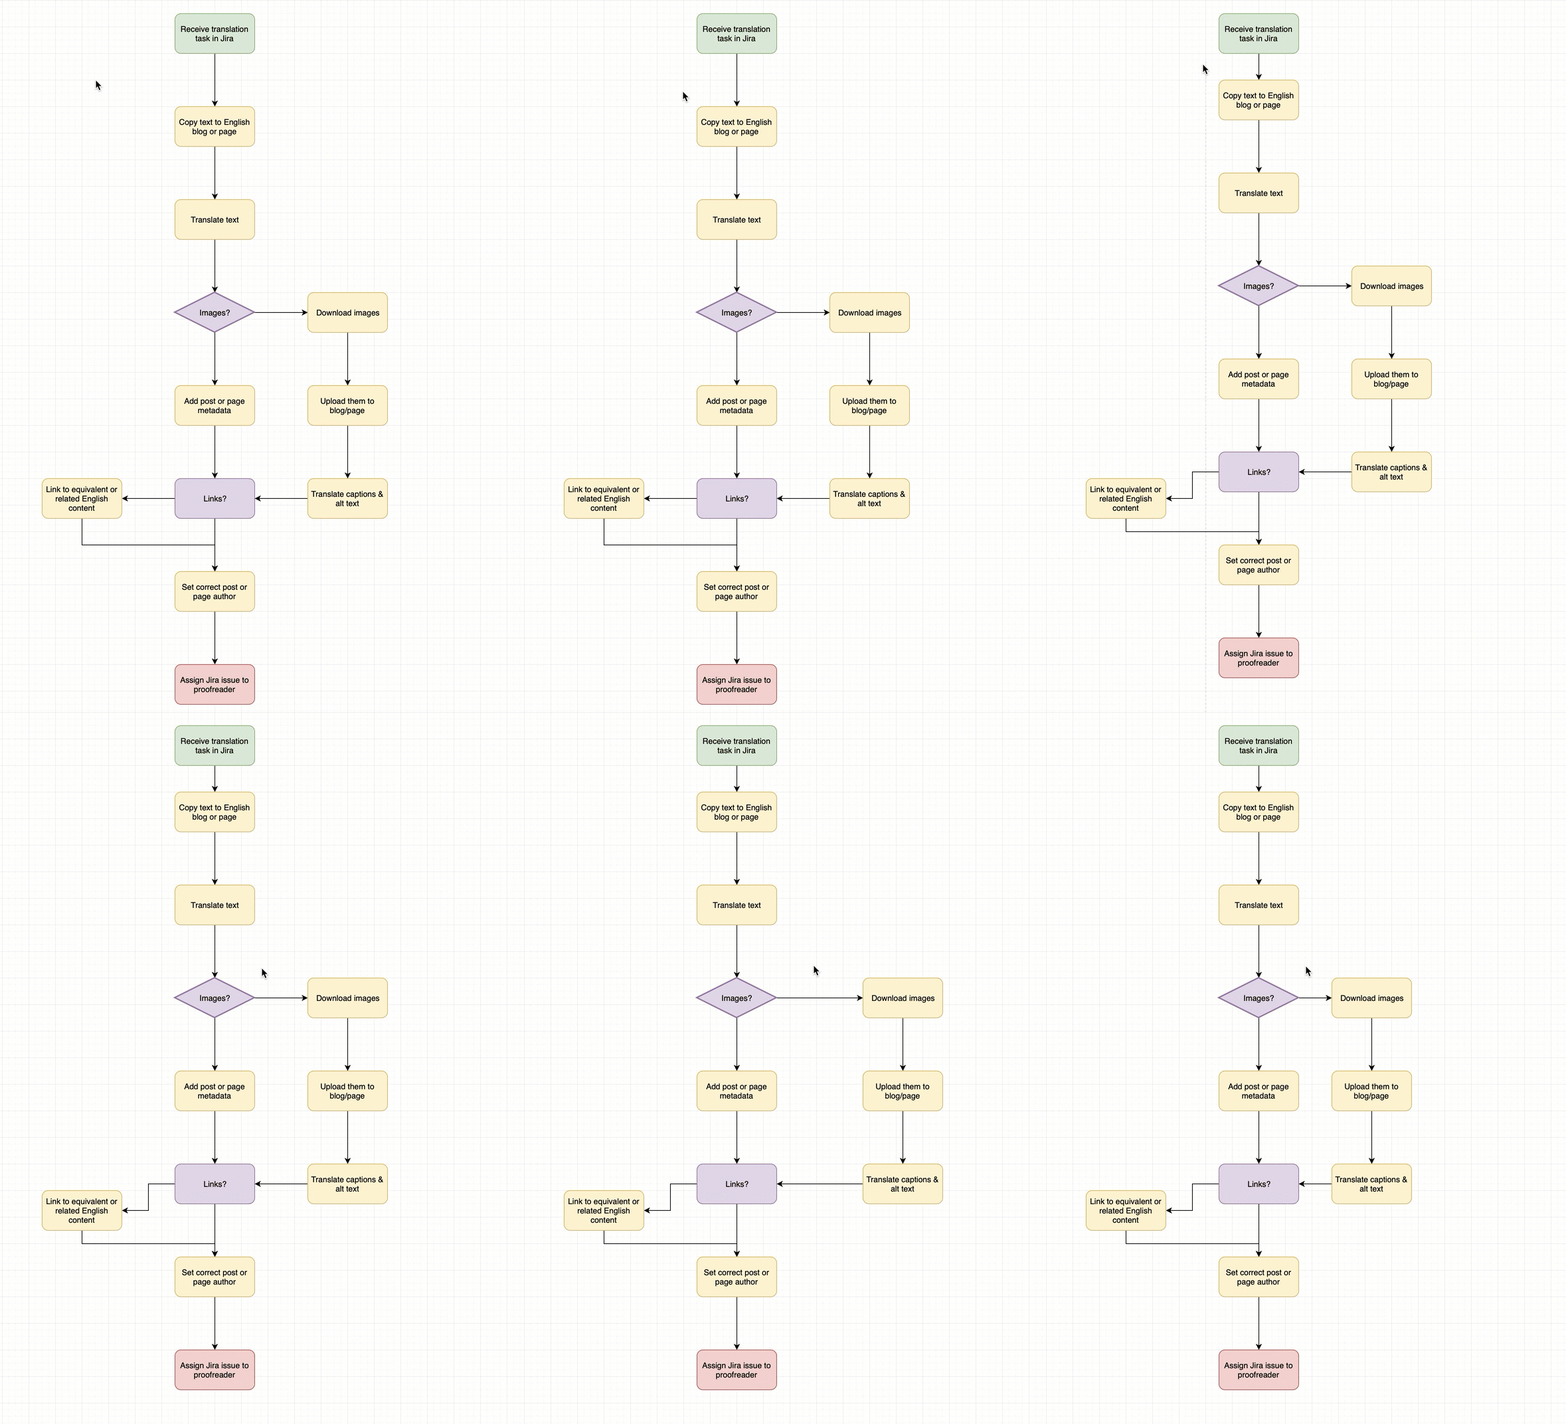
5. Change connector lengths quickly
Instead of changing individual connector lengths, you can change all of the connectors in one horizontal or vertical section of your diagram with one movement.
Hold down Control + Shift and then click and drag your mouse. You’ll see light guiding lines appear. When you click and drag following the direction of the connector, you’ll make them longer. Clicking and dragging in the opposite direction makes the connectors shorter.
Multi-page diagrams make flowcharts easier to read
Because the content I often work with is cross-linked manually, and it’s different in blog posts and our Confluence knowledge base, I wanted to make these steps clearer. By putting these steps on a second page in the diagram and adding a links so the viewers can quickly jump between the two diagram pages, they can follow these steps without being distracted.
See how to work with multiple pages in draw.io diagrams
Add a link to a different page in your diagram
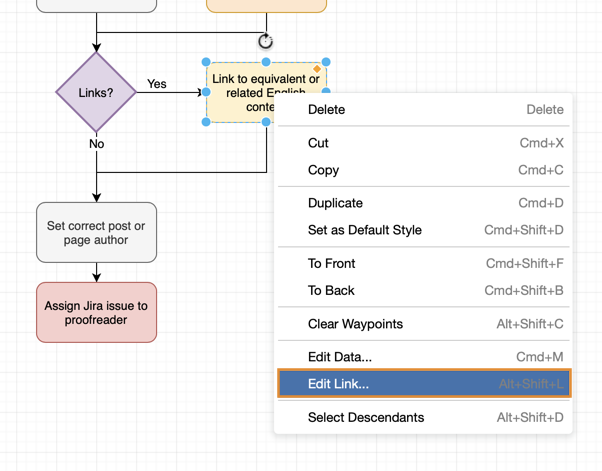
- Right click on the shape you want to add the link to, then select Edit link from the pop-up menu.
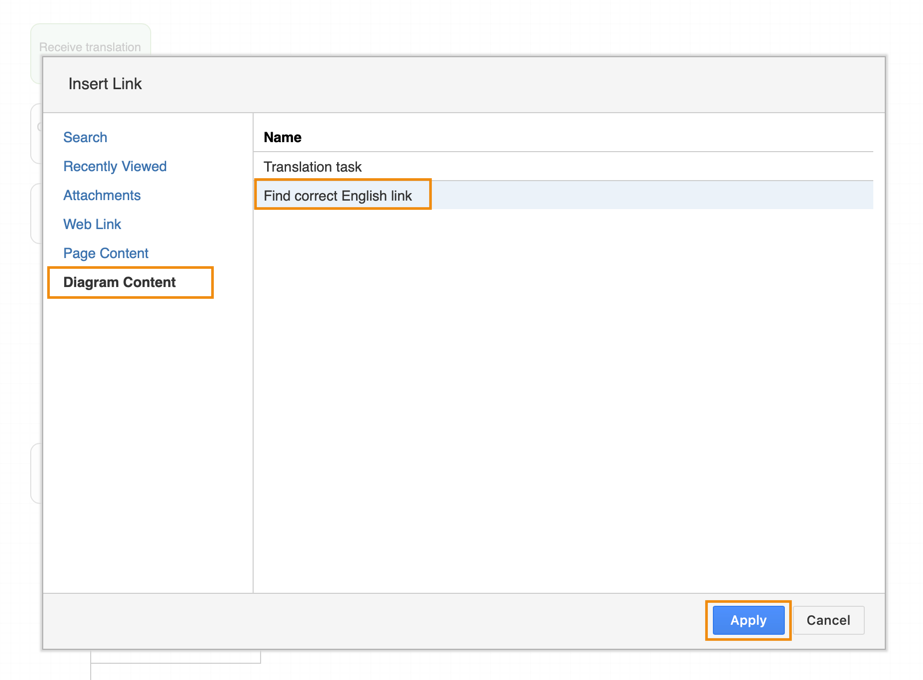
- Click on Diagram Content in the left-hand side of the dialog to see the various pages in your diagram.
- Click on the page you want to link to, then click Apply.
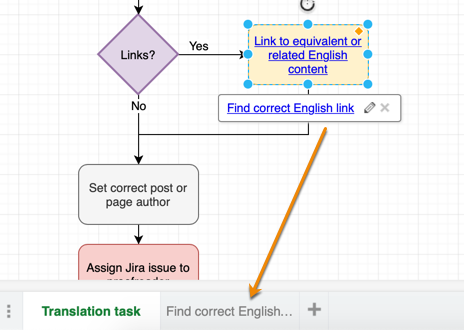
Now, your shape text will be underlined and blue to indicate it is a link, and when you select the shape as you edit your diagram, you’ll see the link target in a ‘note’. You can click the ‘pen’ icon to edit this link if you need to.
Don’t worry – when a viewer looks at your flowchart in the lightbox, they’ll just see the linked shape and text, not the note! When they click on the shape, they’ll jump immediately to the target page in your diagram.
The different shapes used in flowcharts
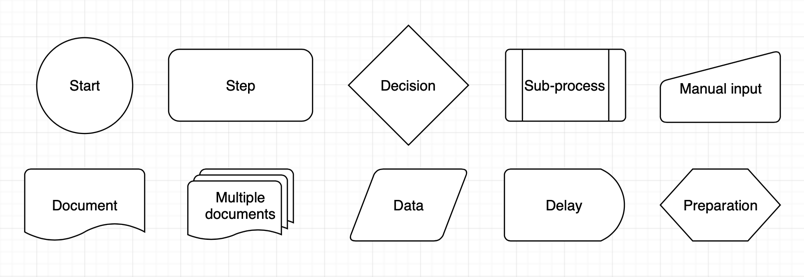
Although my example was very simple and used only two shapes, there are several others that are commonly used.
- Start/End – circles are sometimes used to indicate start and end points.
- Steps – a rectangle or square (often with rounded corners).
- Decisions – usually represented by a diamond.
- A sub-process – a normal step shape with borders on the left and right edges.
- Manual input – where a step requires someone to enter something manually, you can use this step ‘rectangle’ with a sloped ‘roof’.
- Document or multiple documents – where a step results in one or more documents, you can use these shapes
- Data – a parallelogram is used to indicate where information enters or leaves the process. For example, when an invoice is sent to a customer.
- Delay – this is used to show there is a delay before the next step.
- Preparation – used to indicate there are setup conditions required for the next step.
Want to learn how to do more with draw.io? Then head on over to our learning hub where you can access videos, step-by-step guides as well as our interactive tutorials. Want to hear how others are using draw.io? Read about how Solution Architect, Marcel Grossert, uses draw.io to visualize his workflows!
Last Updated on August 1, 2023 by Admin