Why should you stop to read a blog post about tables in draw.io? After all, Confluence has its own table functionality, right? You’re probably more excited about creating stunning diagrams and energizing whiteboards!
And we get it! That being said, while you might not purchase draw.io for its table features, there are some compelling advantages to using draw.io for your table creation, instead of relying solely on Confluence’s built-in Table feature.
So, whether you’re already a draw.io user or considering a diagramming app, the Tables feature is an exciting addition that shouldn’t be overlooked. Enough chitchat, let’s jump right in!
What are the advantages of using a draw.io Table?
While Confluence provides a solid foundation for basic charting needs, let’s explore how draw.io Tables can elevate your experience and cater to specific requirements that go beyond the standard features provided by competing solutions.
Increased design options
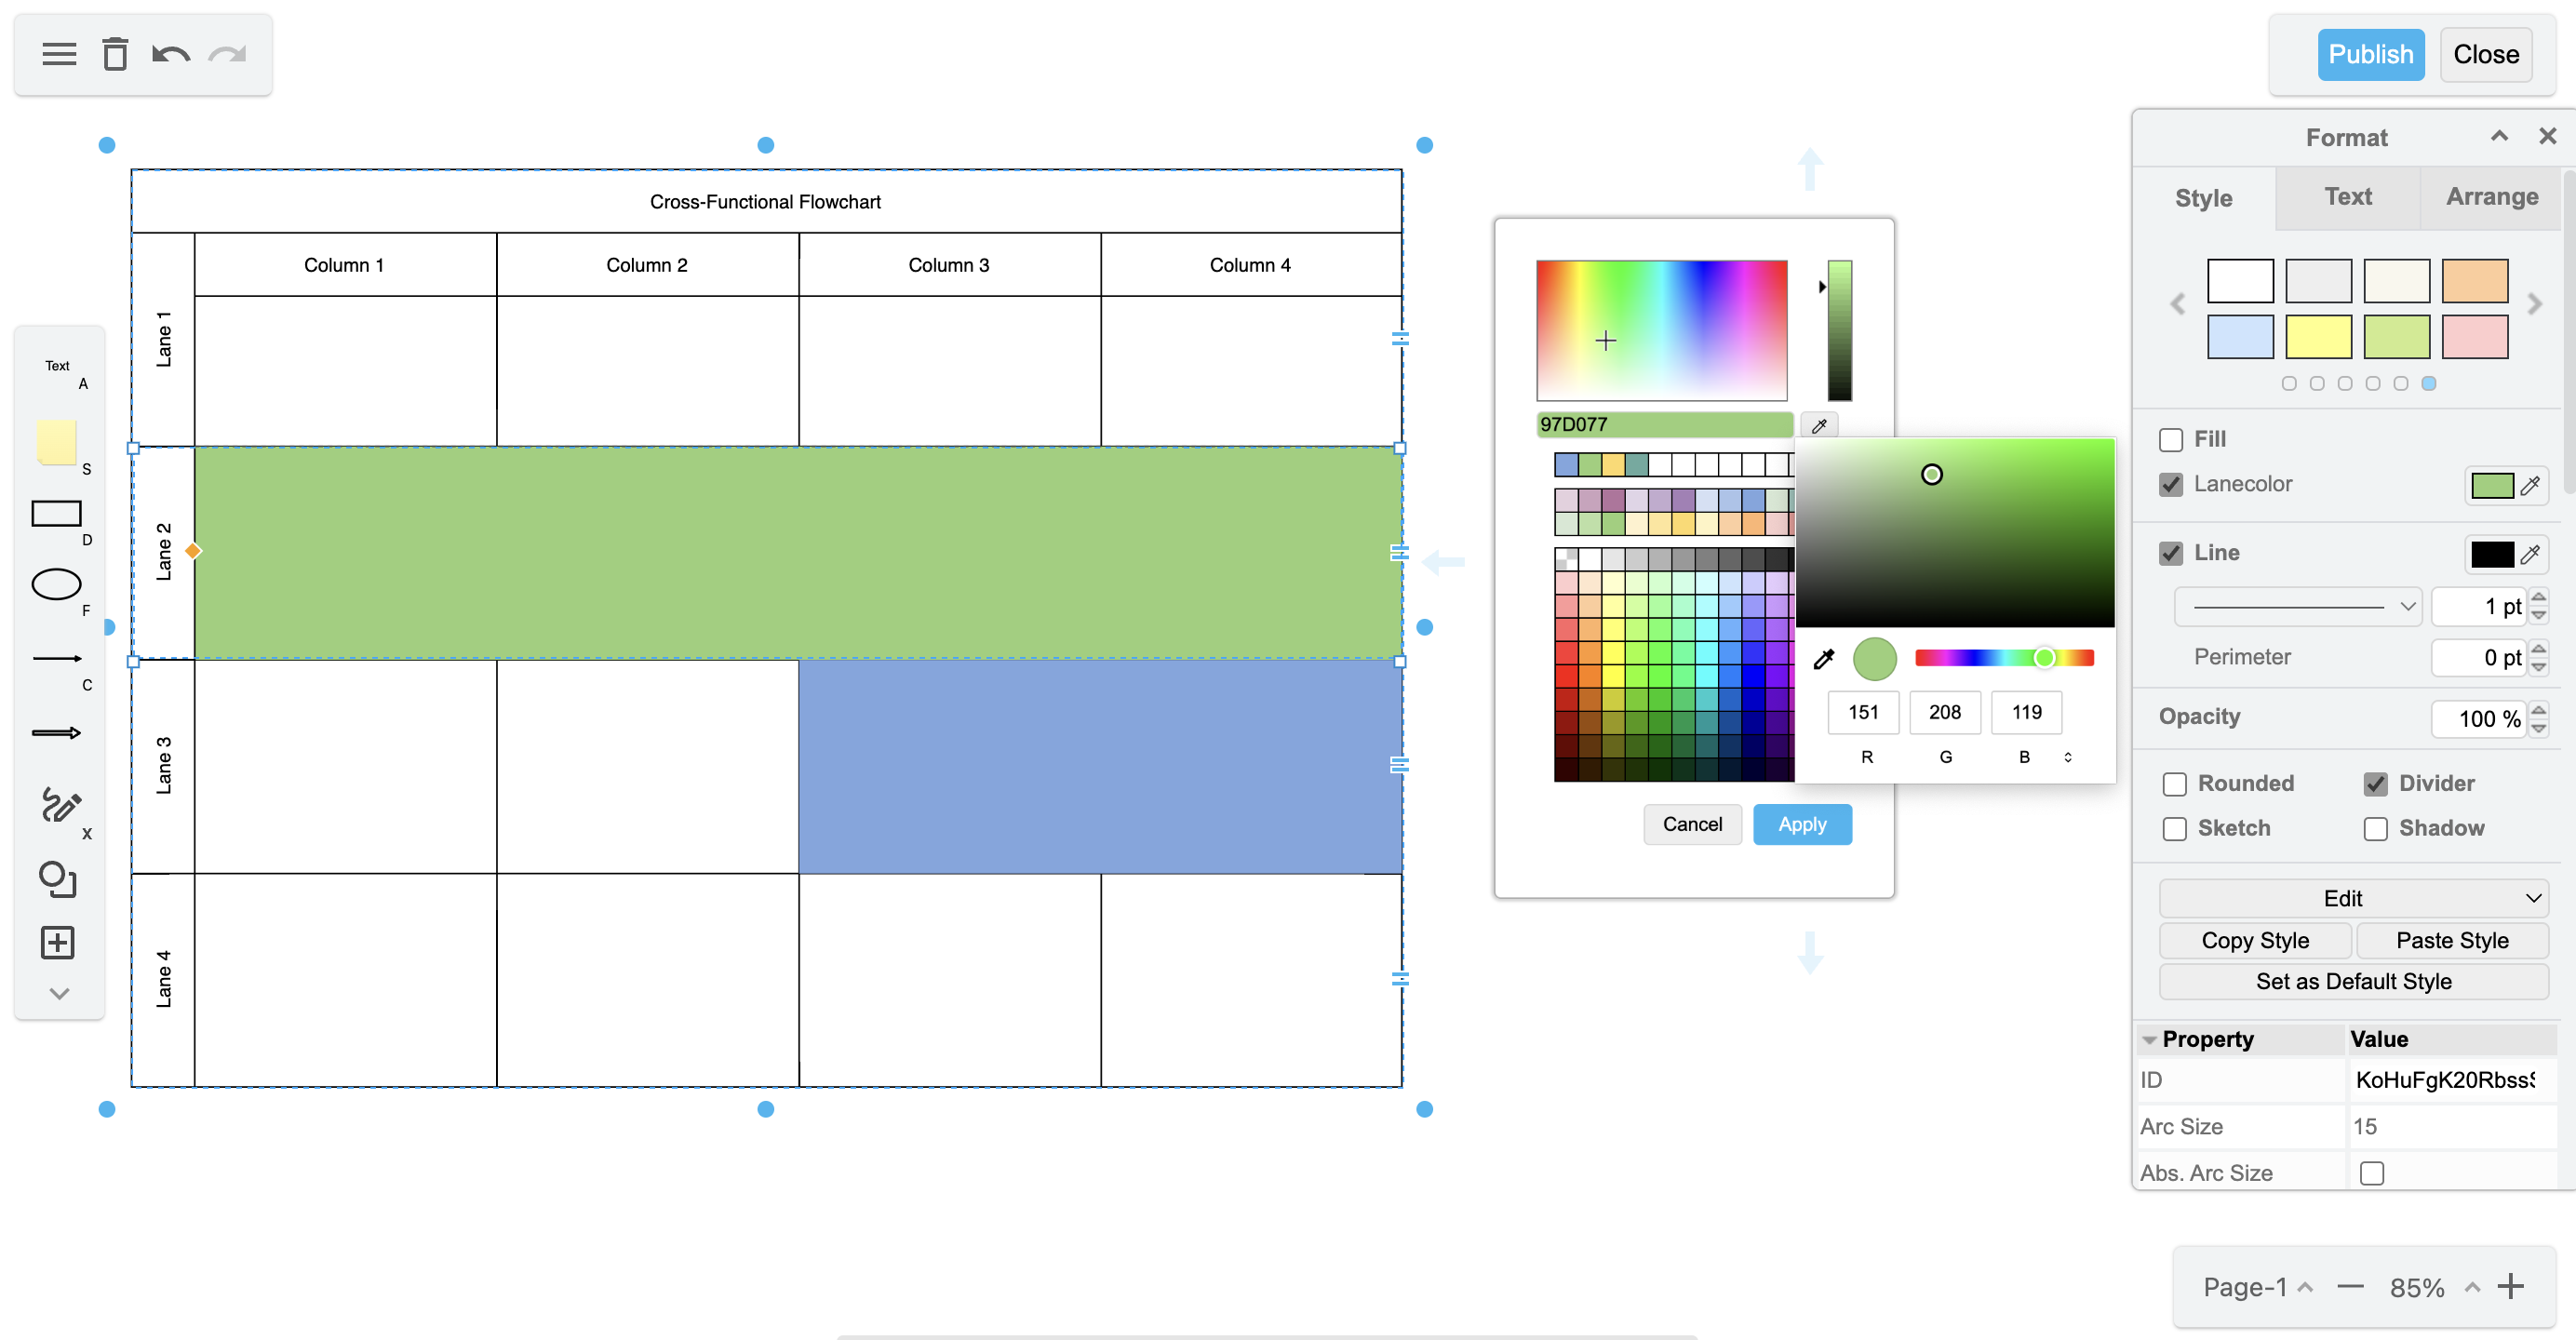
“Form follows function”, as the saying goes. Nevertheless, your company has design guidelines, and you eat with your eyes first! In draw.io you have a full range of design options to choose from. For example, you can use the unique colors of your corporate design directly in your tables, liberating you from the constraints of standard color palettes found in other tools. What’s more, you can customize the size of cells and adjust the separators between rows and columns to your liking.

These options are what distinguish a table that is visually tailored to meet your corporate standards, from an ordinary one. You can find a comprehensive list of all your options on our YouTube channel in the playlist “Tables”.
“Cell-abrating” our features
With these notable strengths in mind, let’s take a look at concrete cases when it comes to table creation with draw.io. The magic word is ‘Relationships’. For tables made with draw.io, you can:
- easily visualize connections between cells
- highlight interdependencies
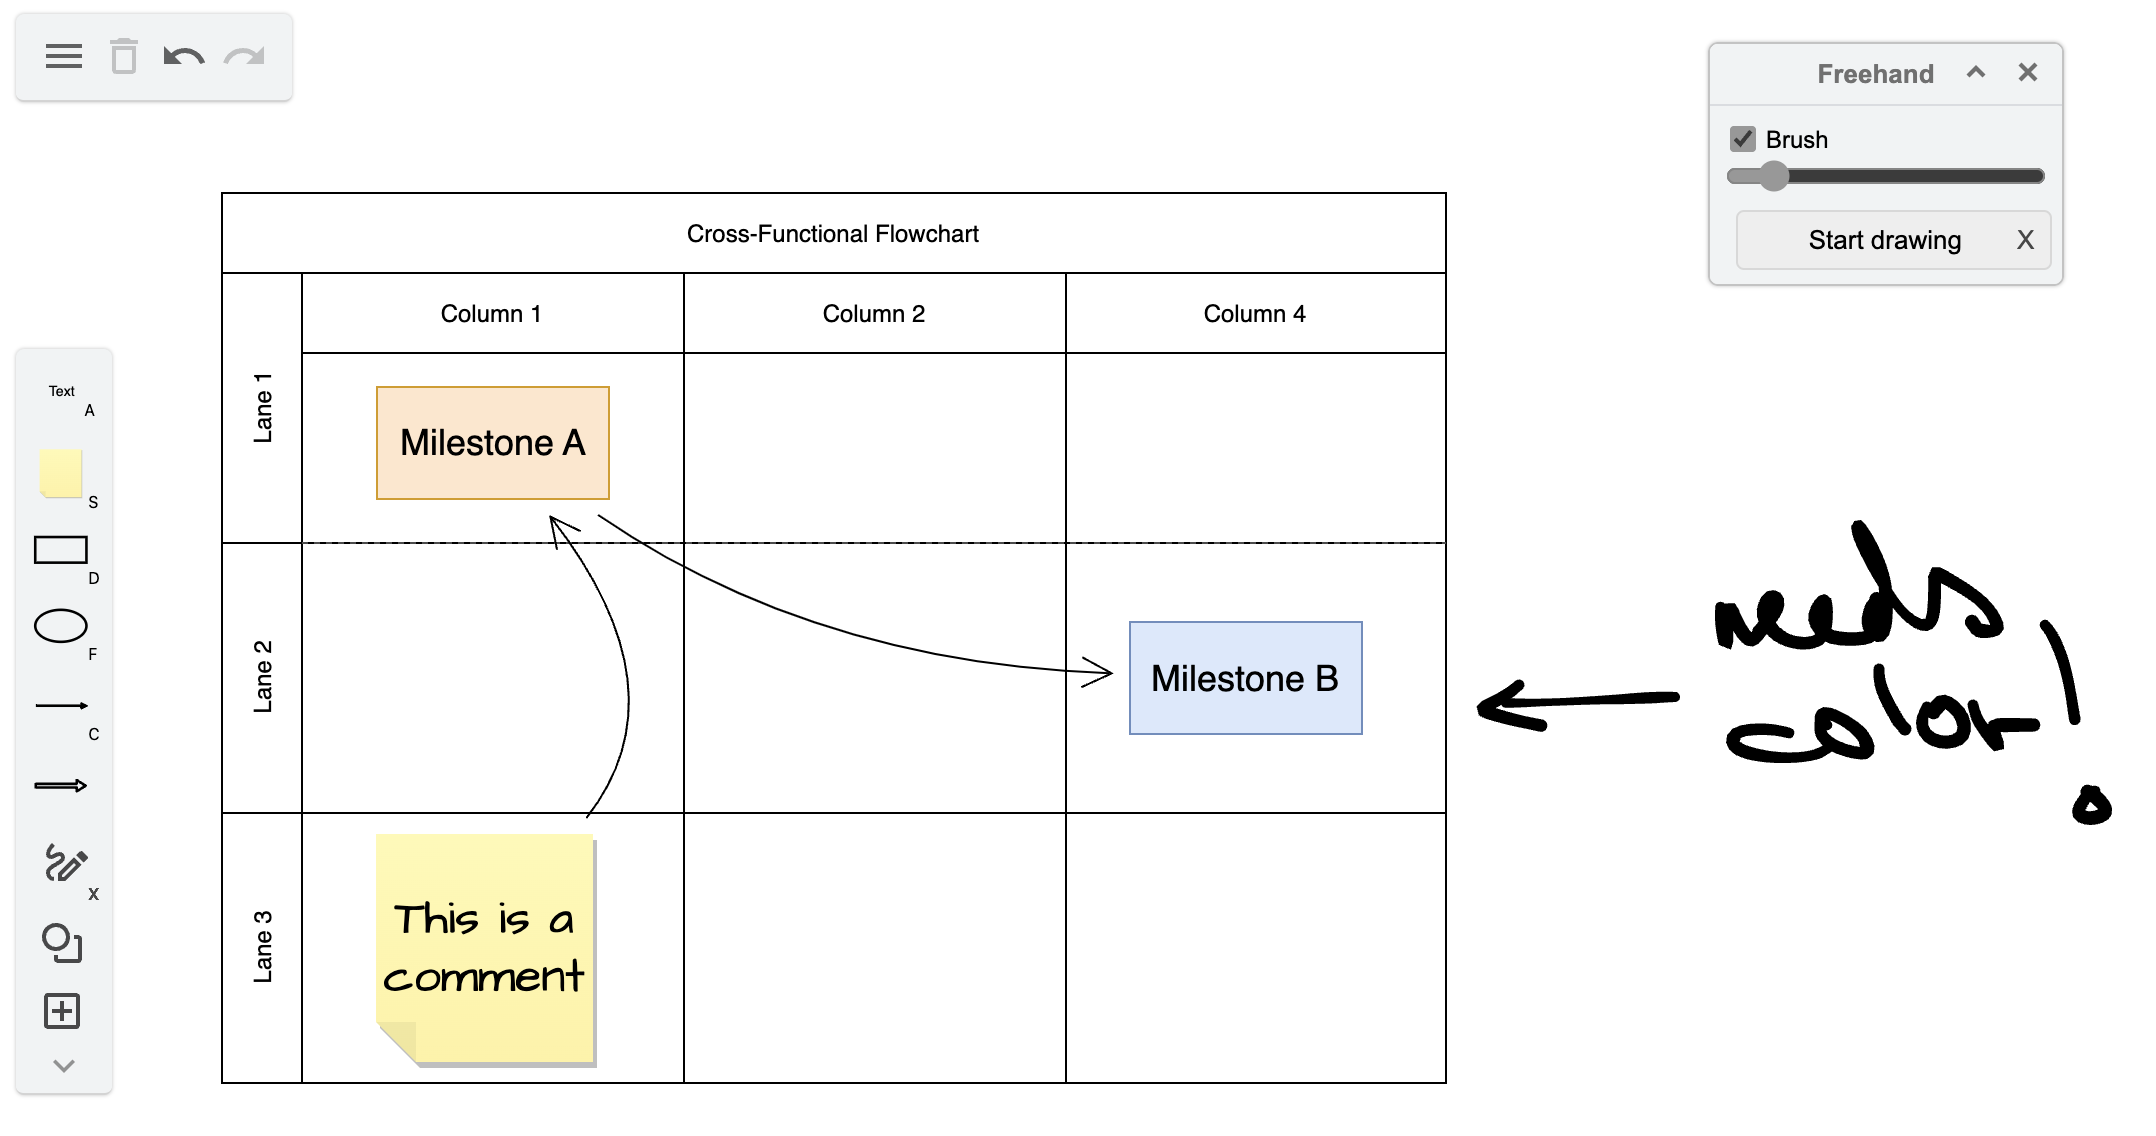
- even add comments directly within your table using virtual sticky notes.
Within our Whiteboard macro, you can further enhance your creativity by manually sketching your comments using the Brush tool.

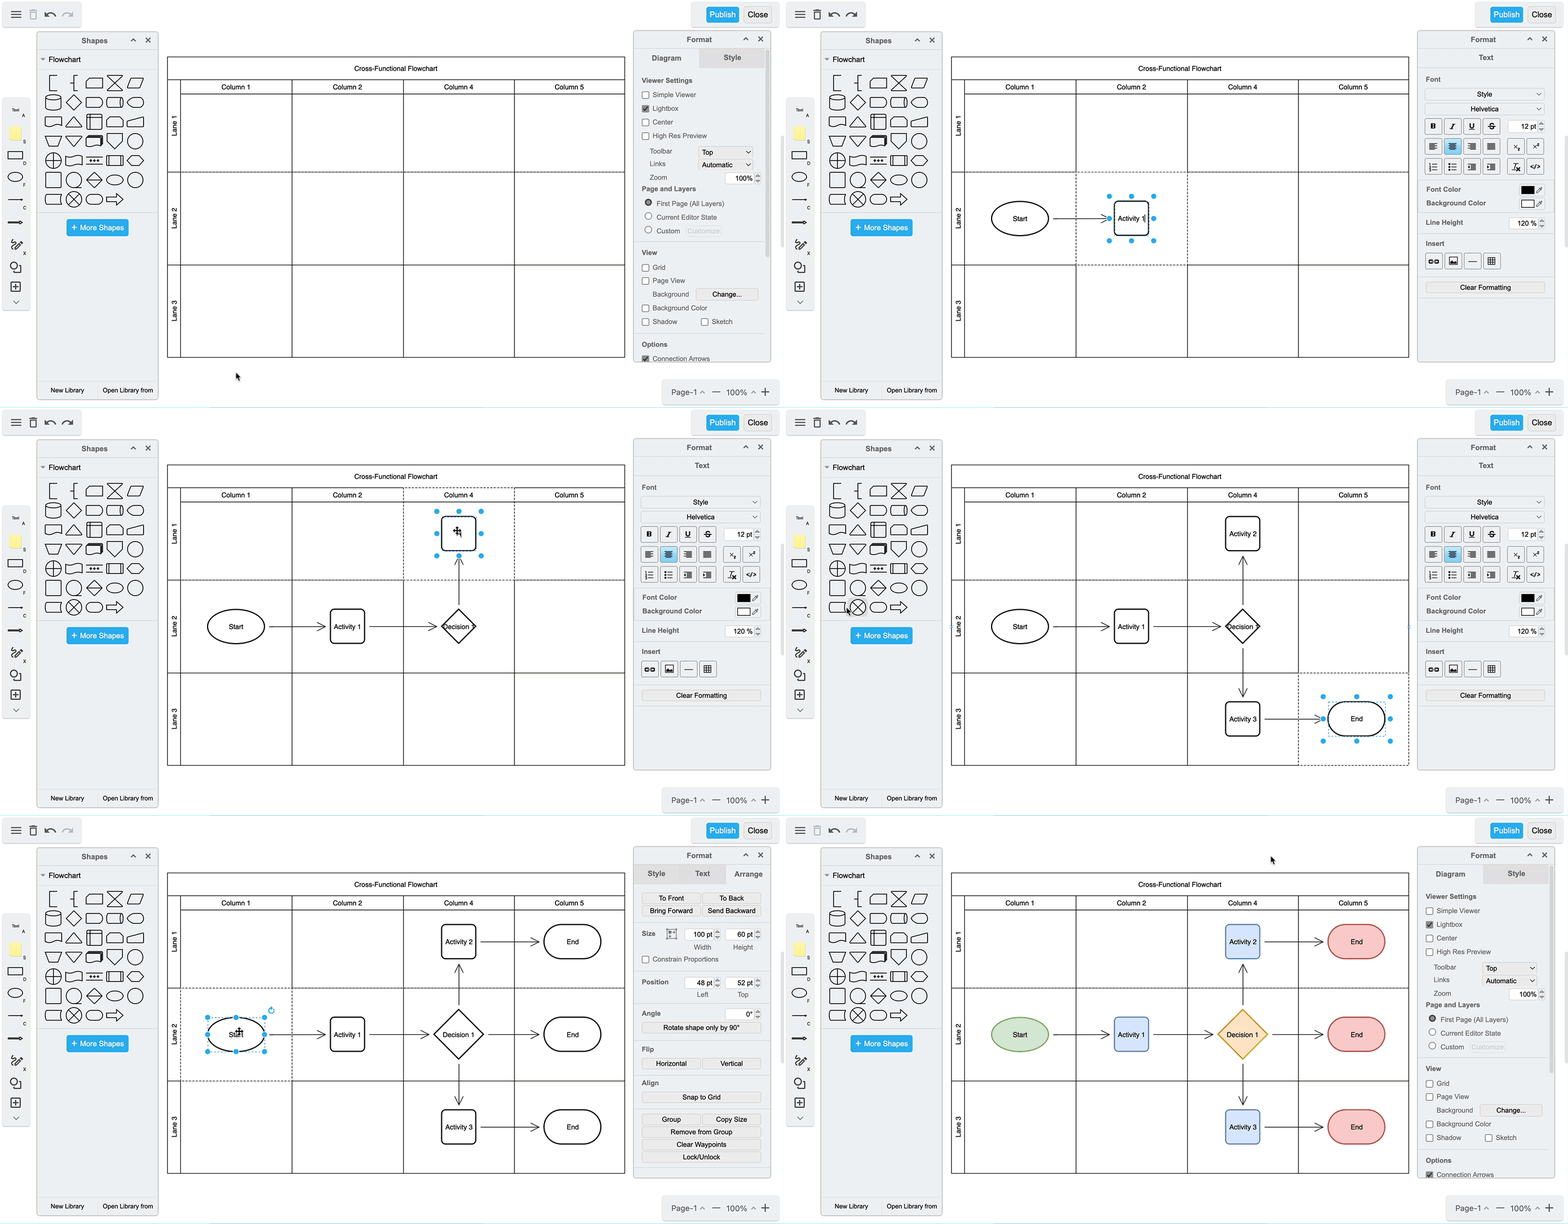
Take a look at the example below to see how using tables for more complex constructs, like this cross-functional flowchart, promotes a better understanding of information, and empowers effective communication.

You can watch all the content mentioned here in detail in the “draw.io Tables” playlist on our YouTube channel.
The Table feature is only one of many advantageous draw.io features. Our blog and social media channels are here to give you fresh ideas and tips.
May the force always draw with you.
Last Updated on July 12, 2023 by Admin

