
We’ve been investing a lot into making draw.io the obvious choice for diagramming in Confluence and Jira over the past year. We’ve fixed a host of minor issues, as well as implemented a number of larger features. Here’s a selection of what we’ve added.
Data governance and lockdown options
Diagram data is stored as attachments on pages in your Confluence Cloud instance, or on issues in your Jira Cloud instance. When you save and load diagrams, data transfer occurs only between Atlassian’s servers and your browser.
A few extended features require operations that cannot be performed within your browser – they require the functionality on the draw.io server endpoints.
The features that use the server endpoints include:
- Export to .pdf files.
- Import from .vsdx, .vsd, and .vssx diagram files, including embedded EMF images.
- Generation of diagram images from PlantUML.
- Import of Gliffy diagrams.
You must manually set the server endpoints in the app configuration. draw.io has server endpoints in two regions: one in the EU (in Frankfurt, Germany), and one in the US (in Northern Virginia).
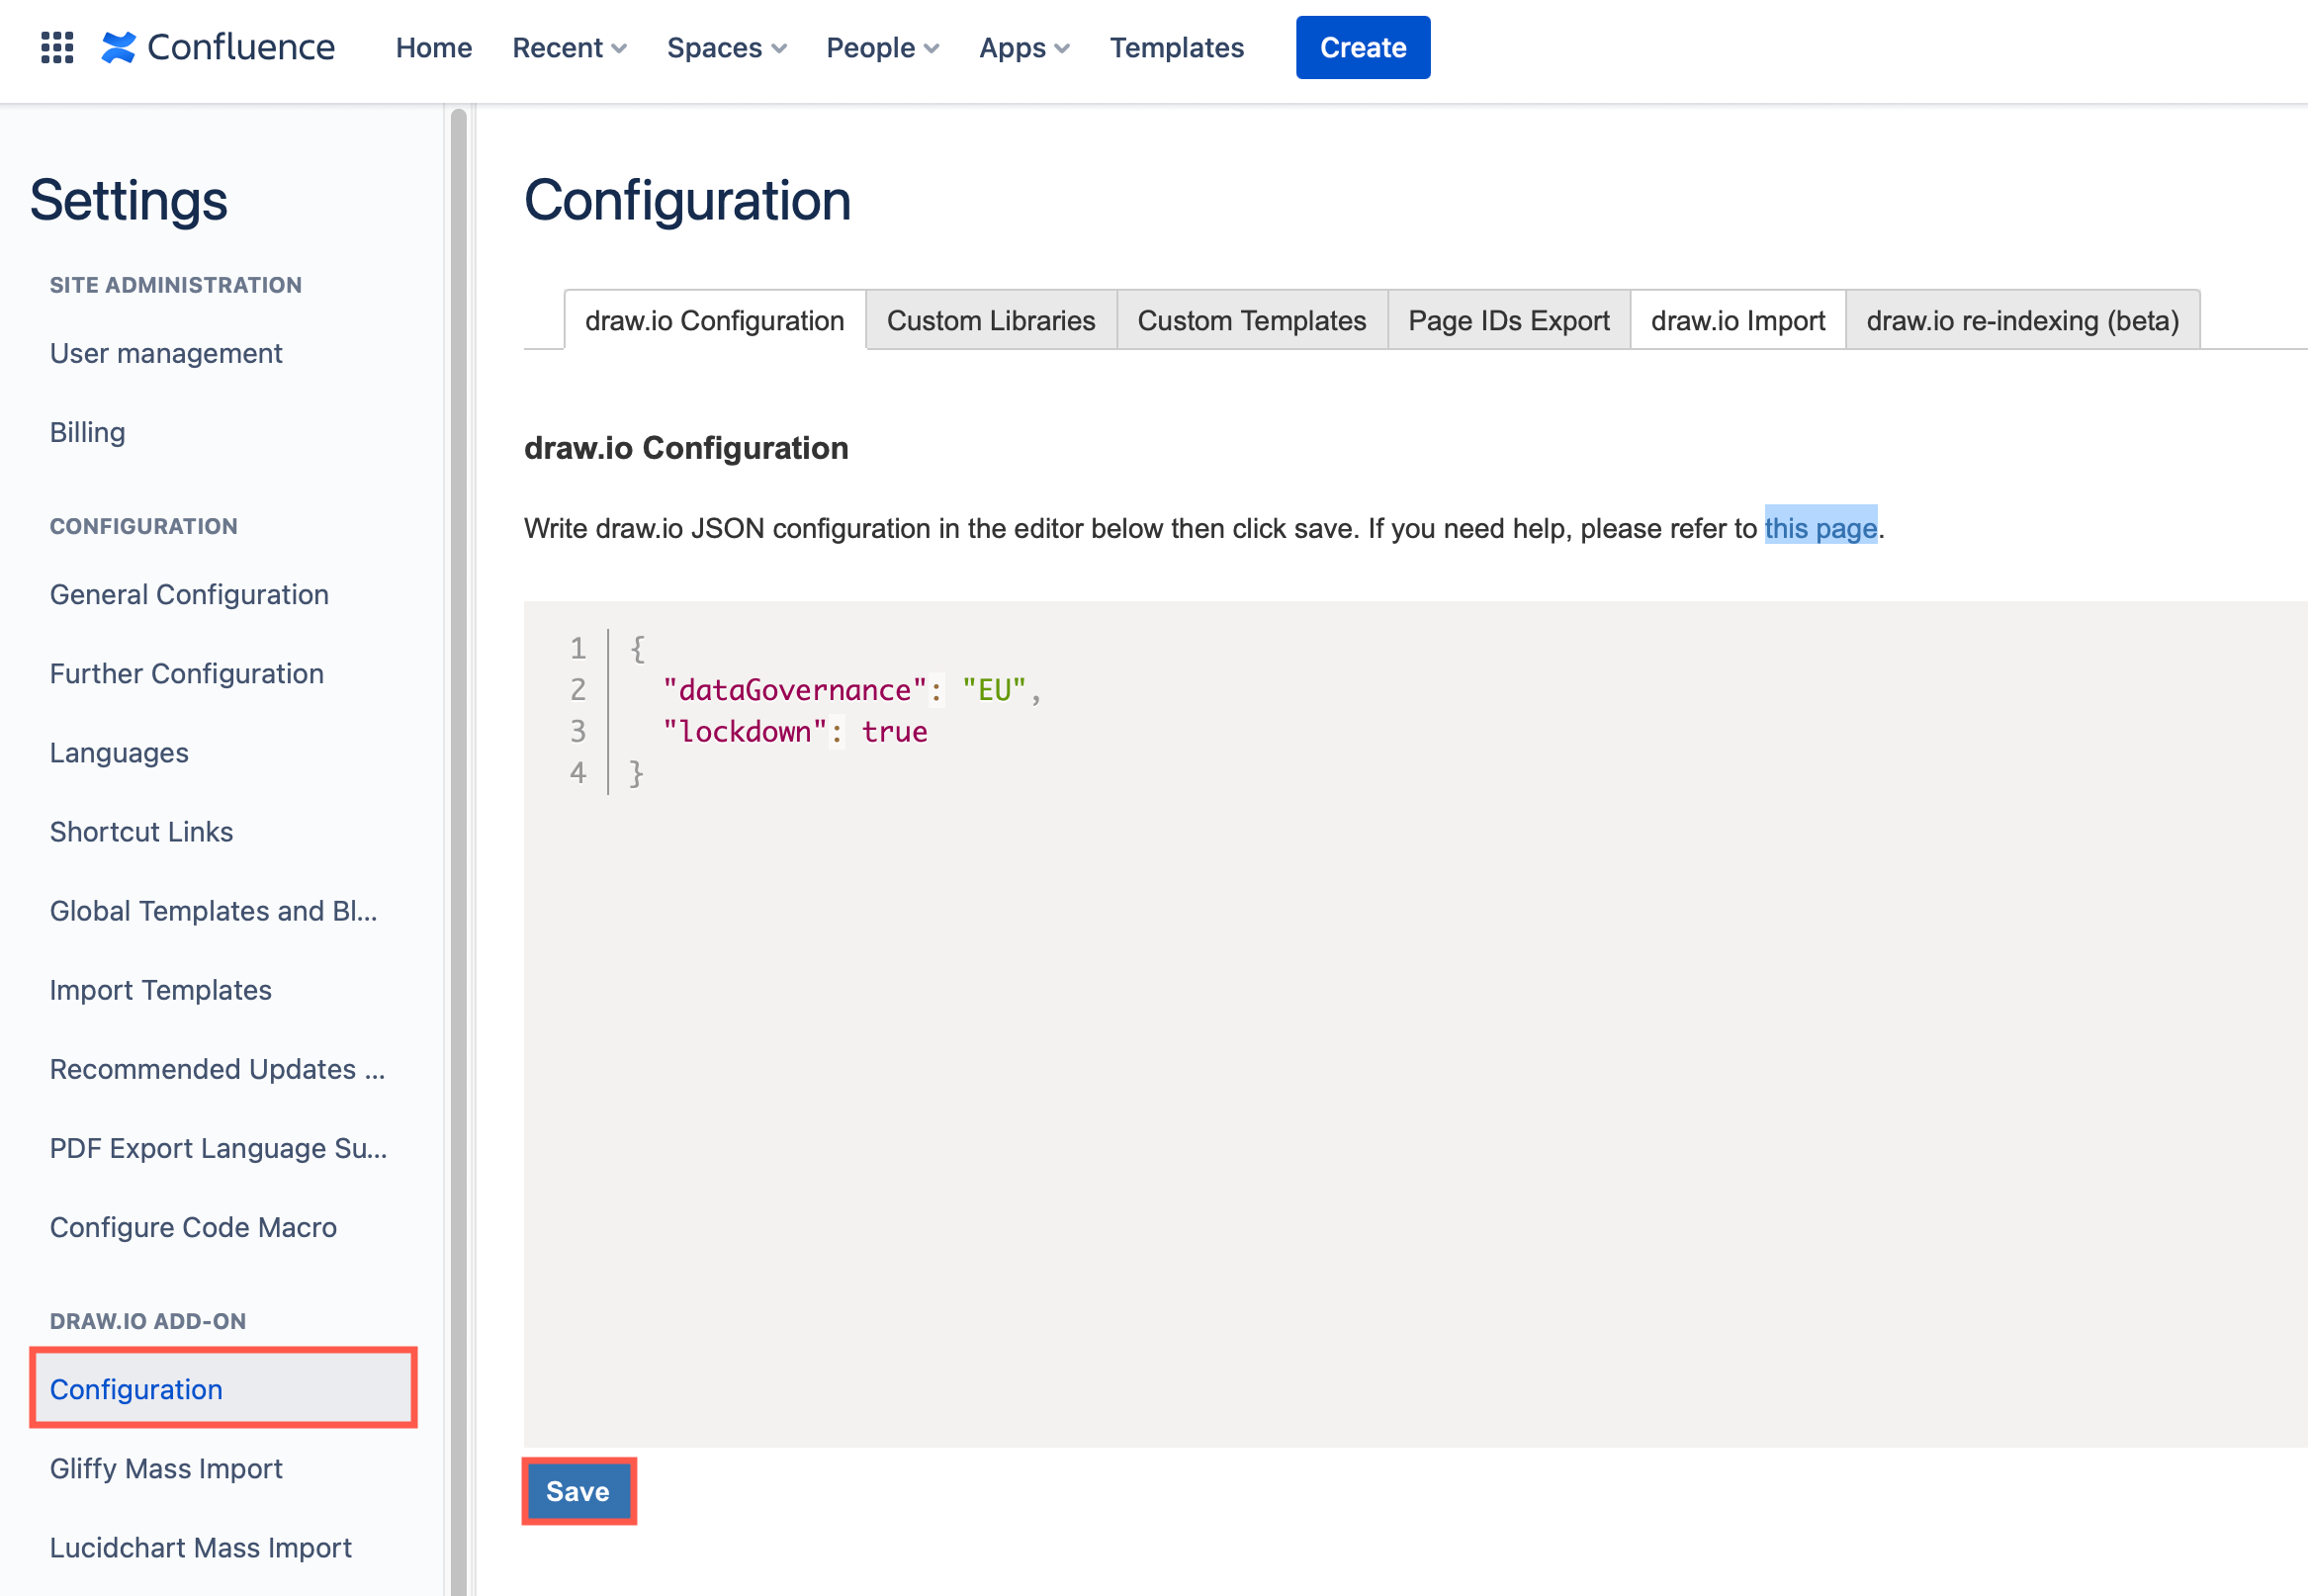
Set your server endpoint (EU or US) for these online services with dataGovernance in the draw.io app configuration.
- Add the following JSON (JavaScript Object Notation) string: "dataGovernance": "EU" or "dataGovernance": "US".
In Confluence Cloud, you can additionally restrict data transmission to between your browser and your Confluence Cloud instance only (and disable the features above).
- Add the following JSON string to the draw.io app configuration: "lockdown": true". Note the dataGovernance value is ignored with lockdown set to true.
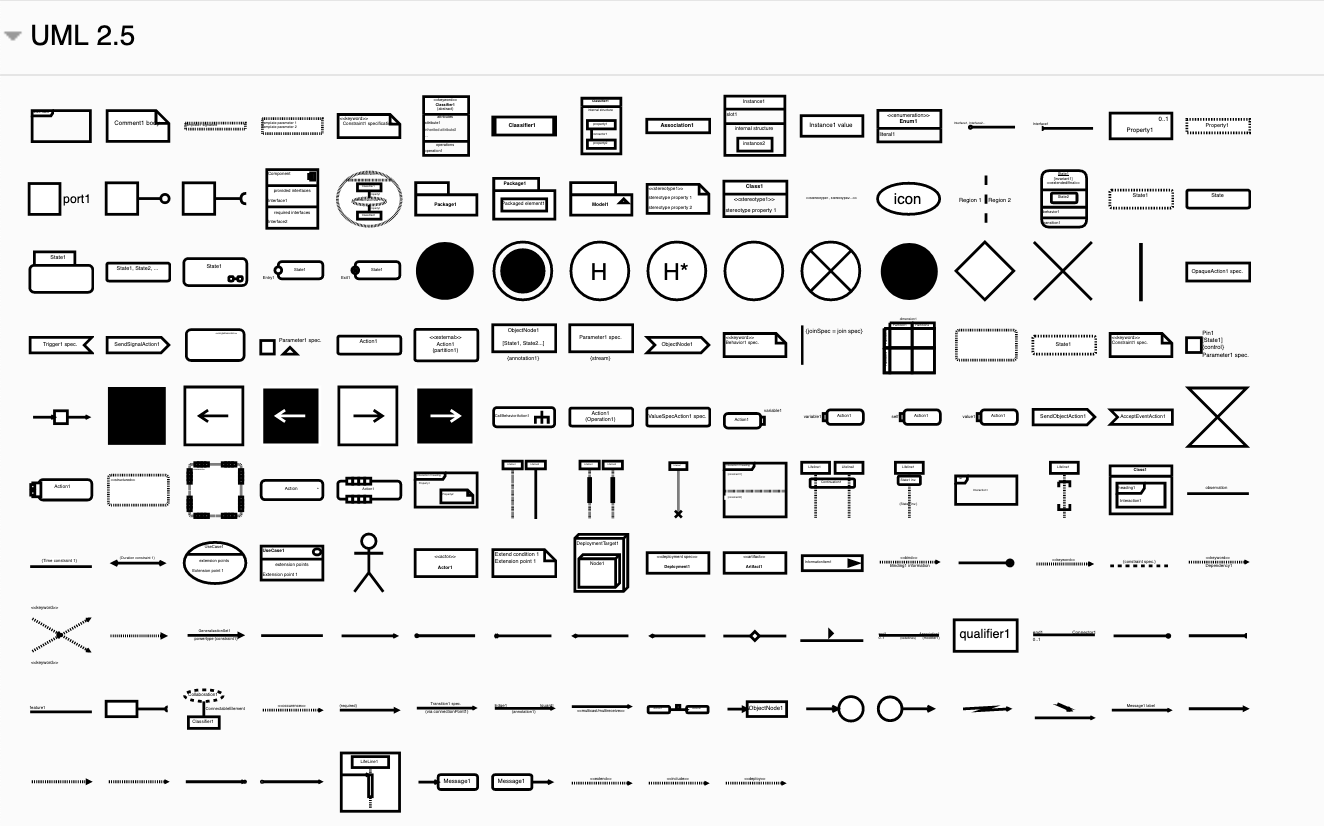
New UML 2.5 shape library
The UML 2.5 specification updated the notation – the shapes – that are used in UML diagrams so they could represent a wider range of concepts more clearly. The specification document was extensively rewritten to make it easier to understand. We’ve added a new UML 2.5 shape library to reflect these changes.
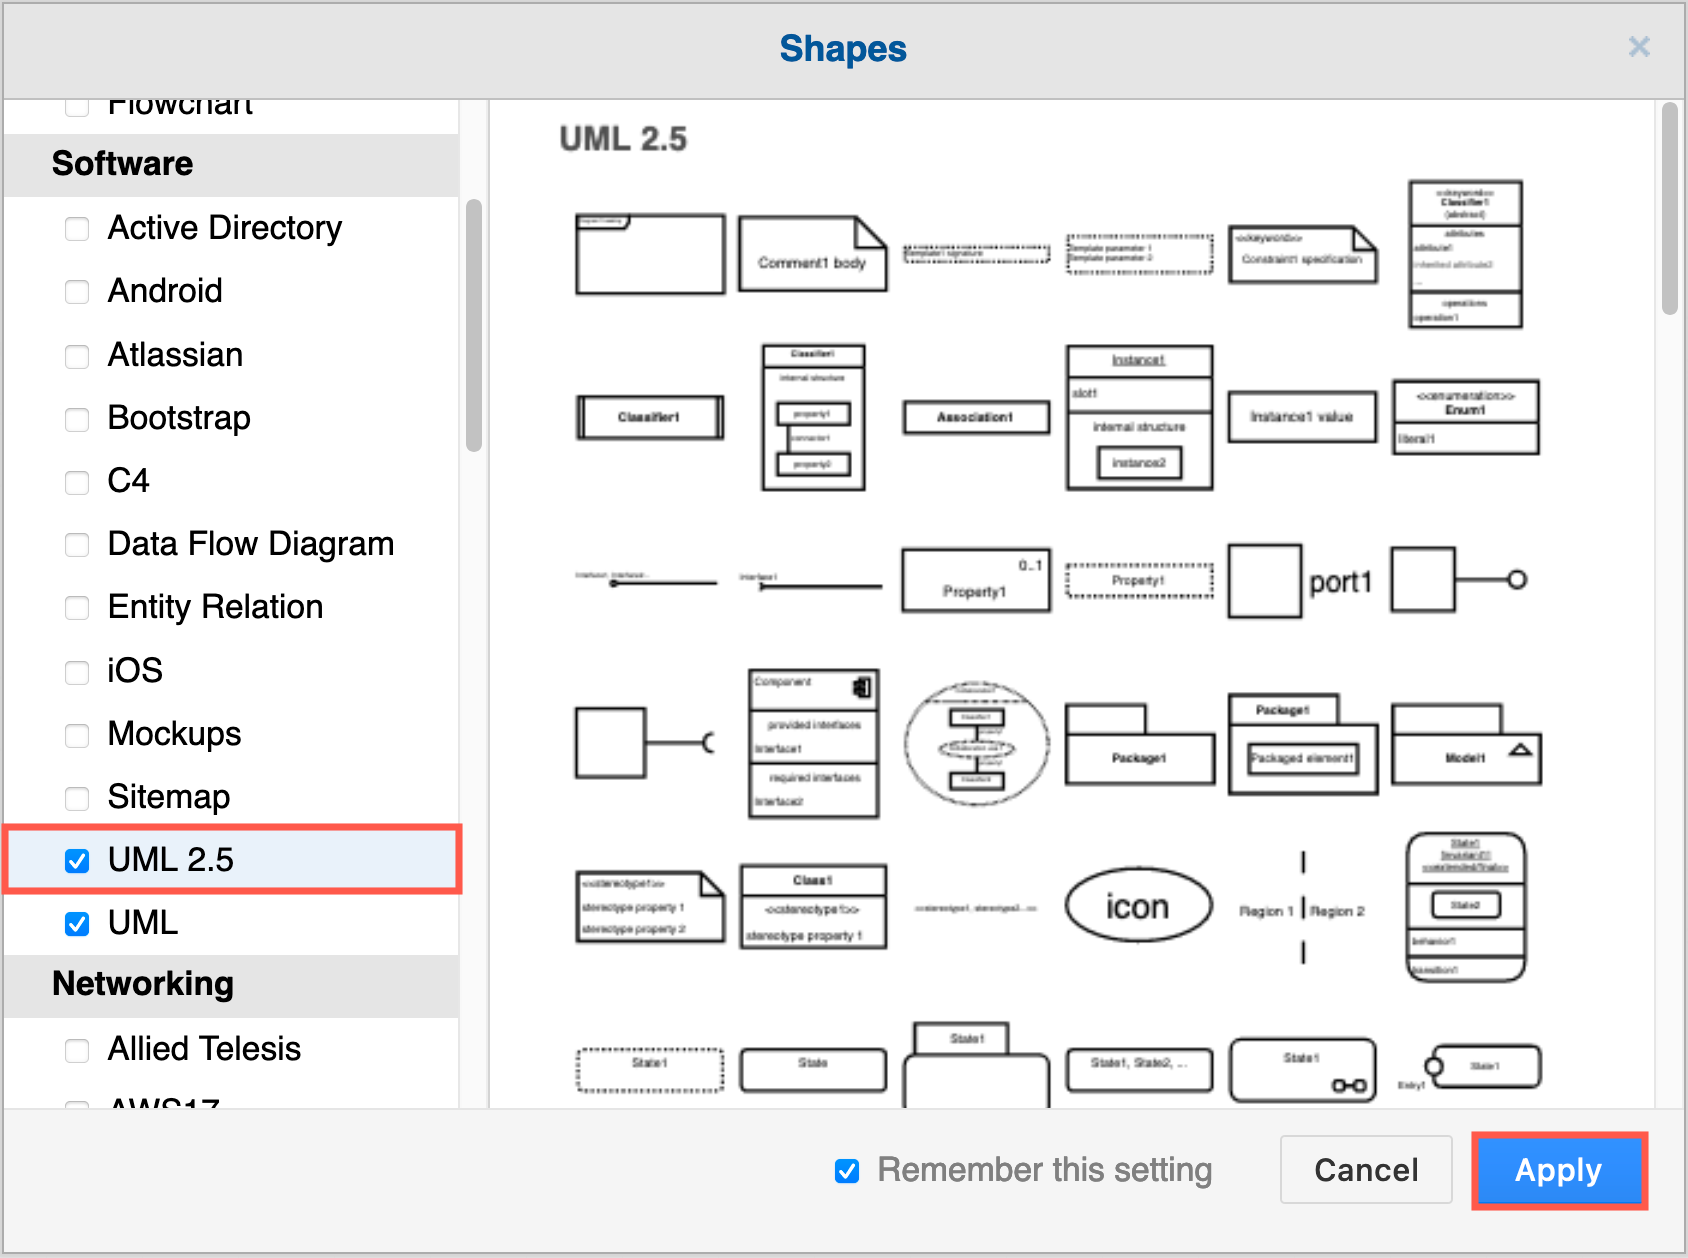
Enable the UML 2.5 shape library:
- Click on More Shapes at the bottom of the left panel when editing a diagram in draw.io in Confluence or Jira. Then scroll down and click on the checkbox next to the UML 2.5 shape library in the Software section, then click Apply.
Dynamic shape selection
The double click behavior in draw.io was updated to be more convenient. When you double click on the blank drawing canvas or click on one of the direction arrows of an existing shape on the drawing canvas, a selection box will appear – click on one of these to quickly add that shape or text to your diagram.
You can choose from a range of common shapes from the General shape library, using your default style.
Collaborative editing
draw.io for Confluence Cloud now supports collaborative editing using the autosave feature that is already built into the diagram editor. Multiple users can edit a diagram at the same time and see all of the changes that everyone makes, without manually synchronizing or merging changes.
In the examples, two browser windows are open and editing the same diagram as if they were two different Confluence Cloud users.
- When two users add shapes to the same location, draw.io will simply overlap them.
- When a child shape is added to a parent shape that another user has just deleted, the child shape will appear on all diagrams. However, the connector leading to it will not exist as the parent shape will be deleted.
Sketch rough style for shapes
draw.io has integrated rough.js into our existing, and fairly limited, comic style, and the result is quite useful. A more relaxed and informal style for shapes, fills, and lines is good in infographics, teaching materials, maps, and reports.
Enable the rough sketch style via the Style tab on the format panel.
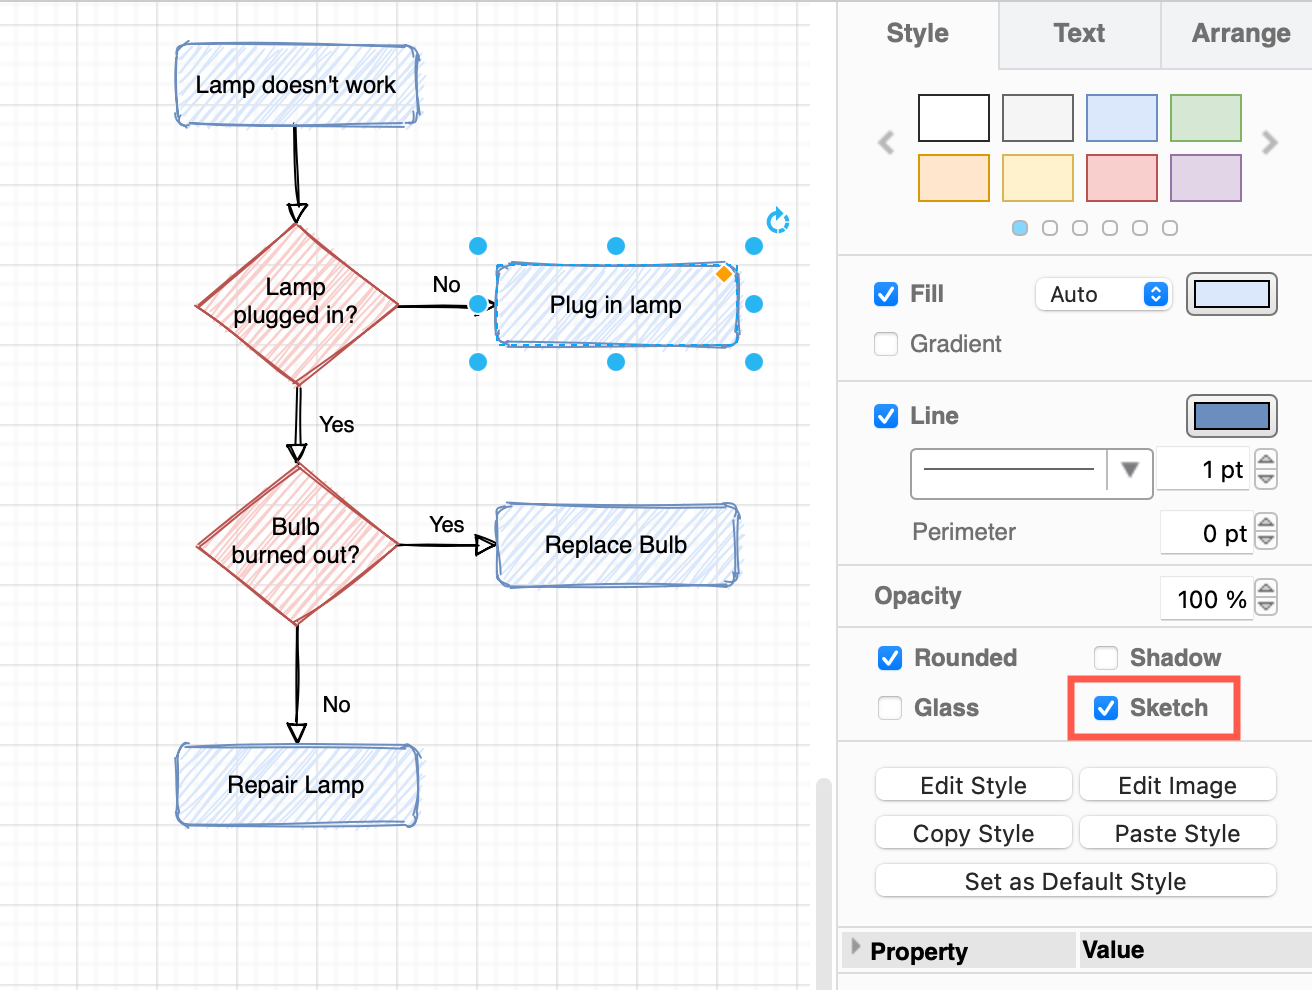
To change the sketch style, change the shape properties. Click on a shape or connector, then expand the Properties section. The most common properties you will want to change include:
- Jiggle – roughness of the borders, connectors, and fill colors.
- Fill Weight – width of the ‘pen’ used to draw the fill color.
- Hachure Gap – distance between the sketched fill lines.
- Hachure Angle – direction of the sketched fill lines.
- Disable Multi Stroke – one pass of the ‘pen’ in the sketched border.
- Disable Multi Stroke Fill – one pass of the ‘pen’ in the sketched fill color.
- Sketch Style – rough or comic sketch styles.
Template color schemes
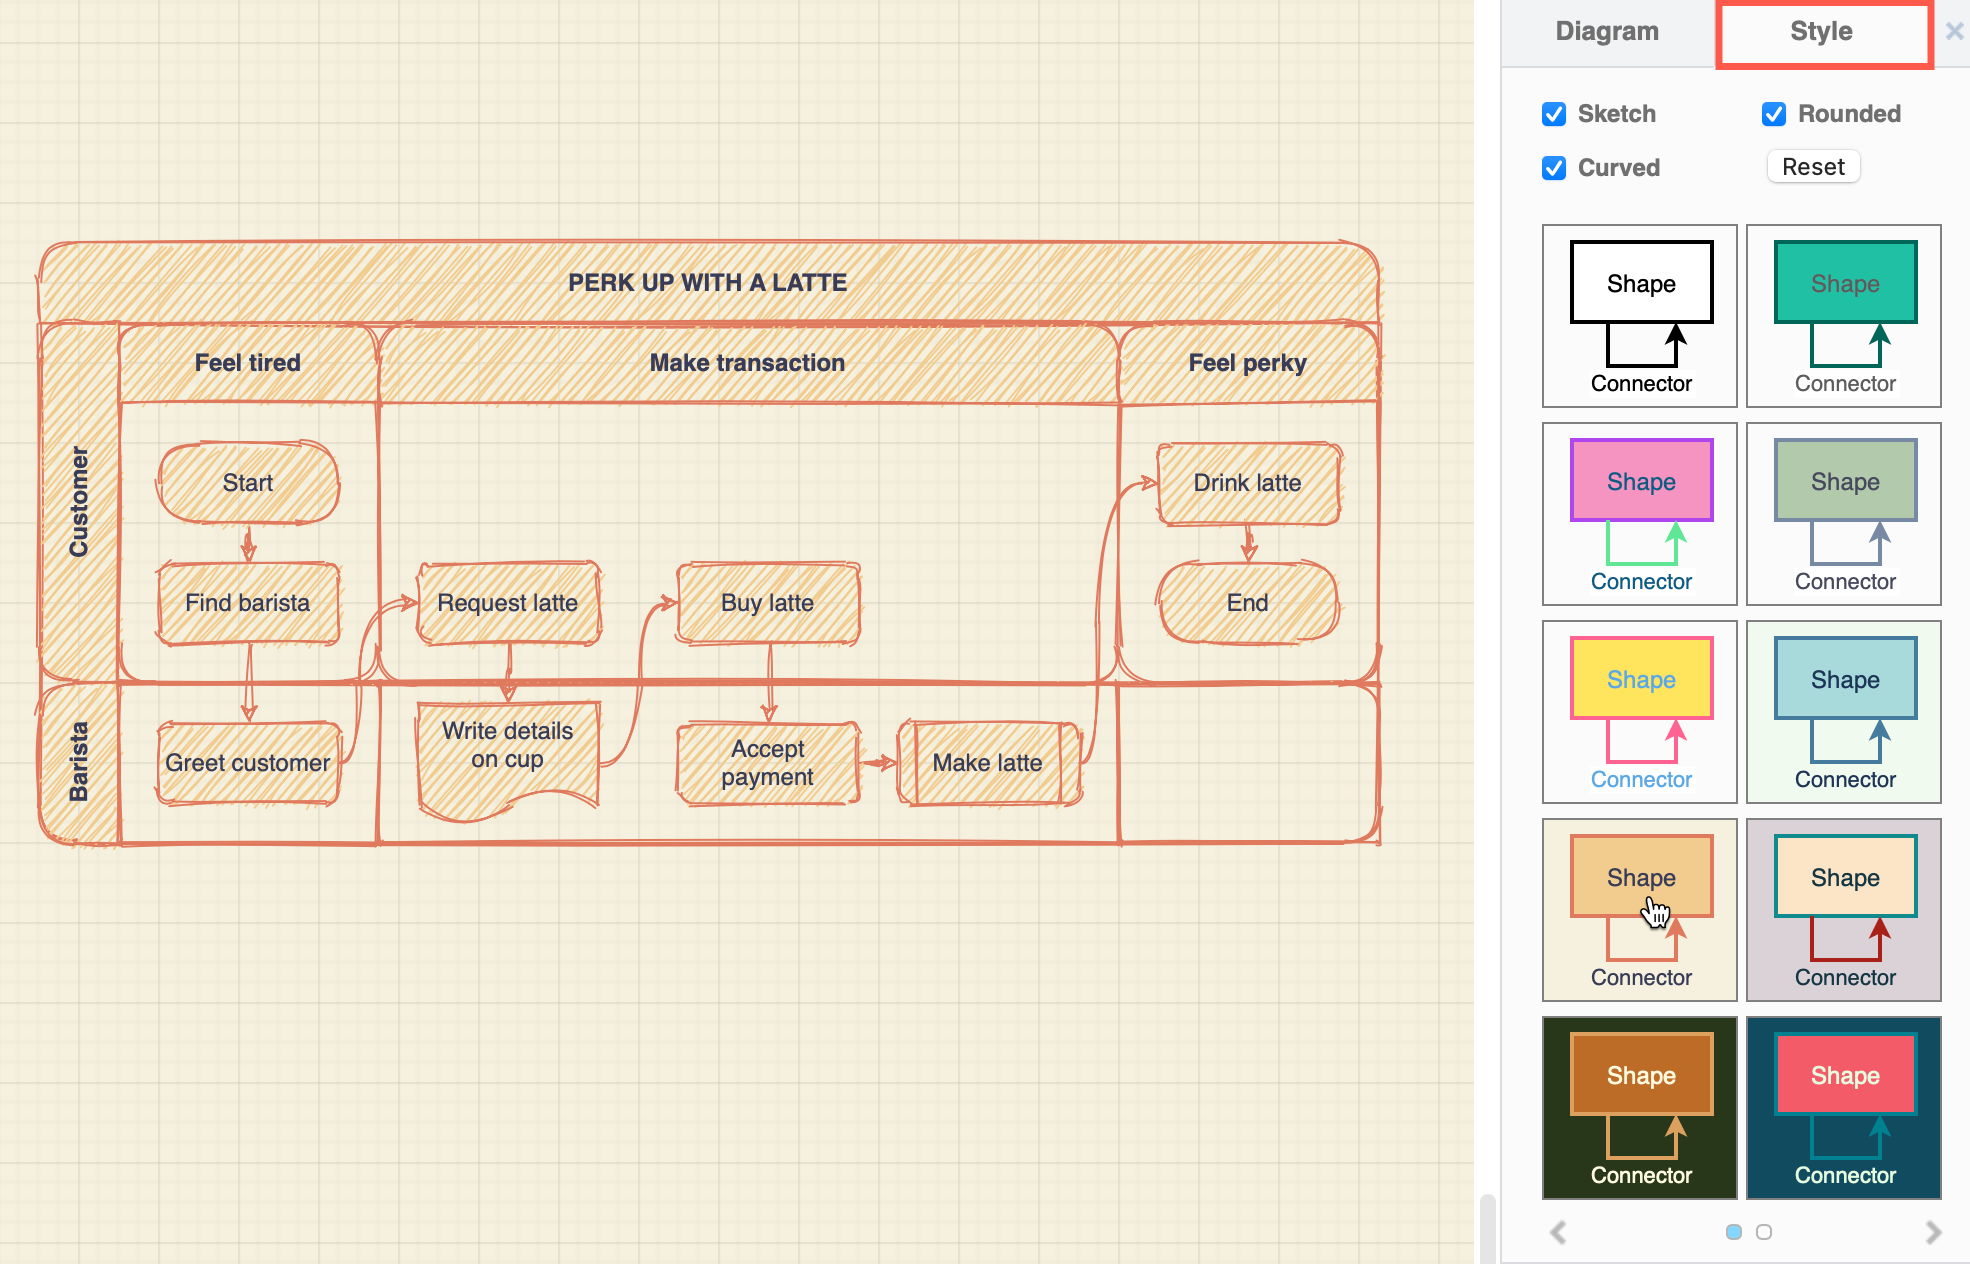
Instead of styling all of the shapes and connectors in your diagram individually, you can now apply template color schemes to your entire diagram.
Make sure nothing is selected in your diagram, then select the Style tab in the Format panel. Choose from one of the schemes (over two pages) to update the styles of the diagram background as well as all shapes and connectors in one click. Hover over the style to see a preview.
Use the checkboxes to change the style of connectors to Curved, select Rounded to round the corners of all rectangles, or apply the Sketch style.
draw.io bug bounty program
Security is important to us and is a strong focus of our development this year. We jumped at the chance to participate in Atlassian’s Bug Bounty program.
Atlassian has partnered with Bugcrowd, one of the leading crowdsourced security platforms, to help app vendors detect vulnerabilities in Marketplace apps. Bugcrowd uses the collective creativity of a global hacker community – crowdsourced security testing – that helps companies to discover and fix software vulnerabilities.
Brand new tables and updates to related shapes
Tables and shapes that use tables (like the UML entity shapes) have had a massive overhaul to be much more flexible and robust than the old HTML tables you previously used. With the new tables, you can choose from various layouts, drag to resize rows and columns, move rows by dragging them, and build cross-functional flowcharts within a table and its cells.
- Use the table tool in the draw.io toolbar to add a table to your diagram as you would in Confluence.
- When a table is selected, the table tool lets you quickly add or delete rows and columns. Alternatively, use the Arrange tab on the Format panel.
- Hold down Ctrl on Windows or Cmd on Mac to add an empty cross-functional flowchart via the table tool (with additional headings in rows and columns).
Mermaid.js diagrams
Mermaid is a Markdown-inspired syntax where you can generate flow charts, UML diagrams, pie charts, Gantt charts, and more, from a text ‘description.’ After writing this text description, you can insert this text into the draw.io editor to generate a diagram and lay it out automatically.
For example, a flowchart ‘written’ in Mermaid.js looks like:
graph TD
   A(Lamp doesn't work) --> B{Lamp plugged in?}
   B -->|No| D(Plug in lamp)
   B -->|Yes| E{bulb burned out?} -->|Yes| G(replace bulb)
   C -->|No| F(Repair lamp)

New C4 shape library
C4 models, following a system designed by Simon Brown, are used to describe and define architectures in an abstract and simple way. It focuses on four c’s: context (people), containers, components, and code, with different diagrams for each ‘layer’ of detail.
draw.io now includes a C4 shape library with the shapes you need to create all of these diagrams, including extensive UML shape libraries for detailed code documentation. The following is an example C4 container diagram, with a legend showing you the shapes available in the C4 shape library.
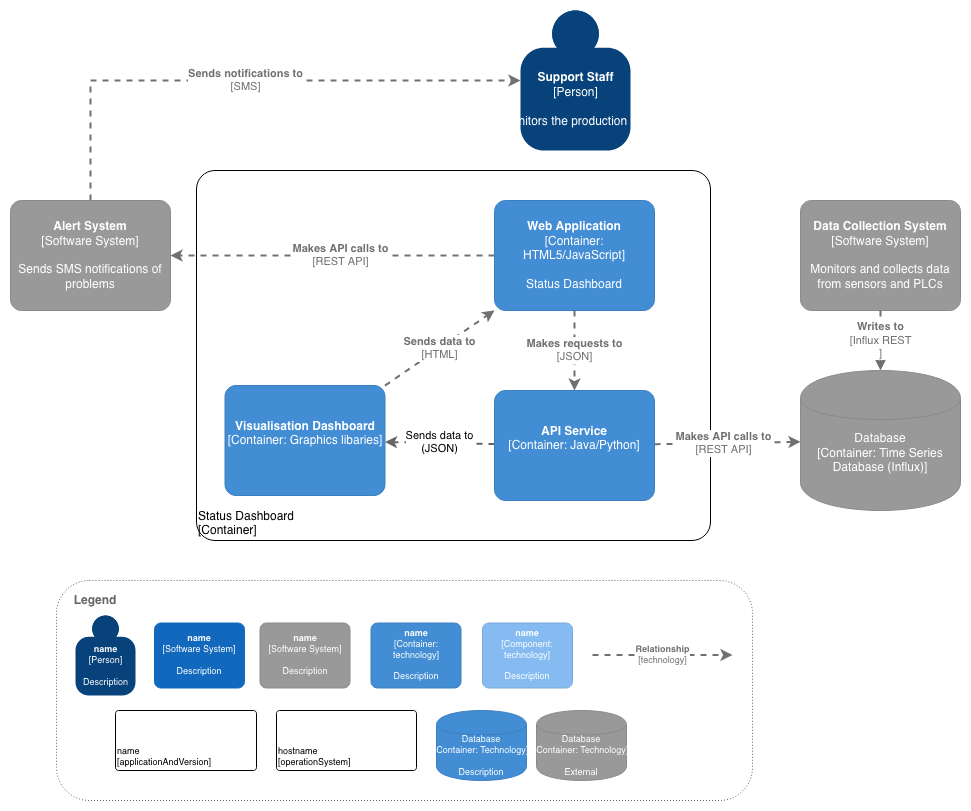
To enable the C4 shape library, click More Shapes at the bottom of the left panel. Then scroll to the Software section, and enable the checkbox next to the C4 shape library. Click Apply.
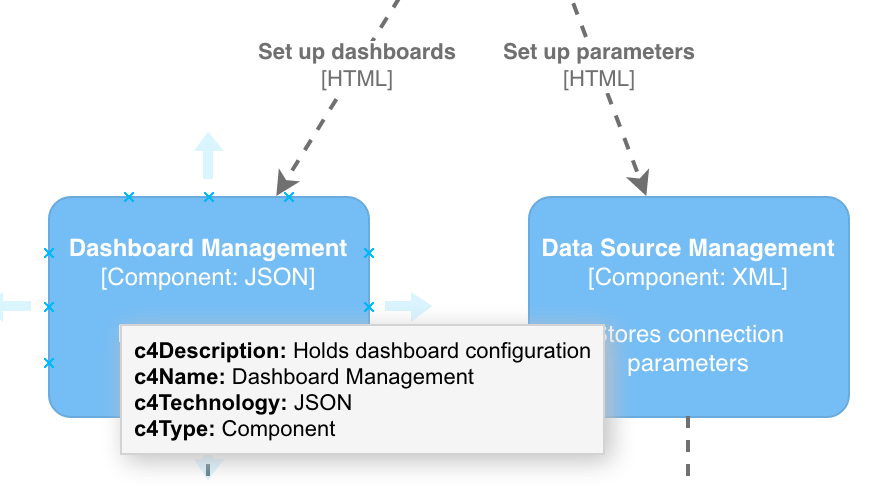
Tip: The shape metadata is used to convey additional contextual information.
Last Updated on April 22, 2021 by Admin