
A good diagram can communicate complex information at a glance. But not everyone sees the same way, including the roughly 300 million people worldwide who experience some form of color blindness. Today we’ll share some tips and tools to help you design diagrams that are accessible for those with color blindness, more accurately known as color-vision deficiency (CVD).
The first thing to understand is that there are actually several kinds of CVD, including:
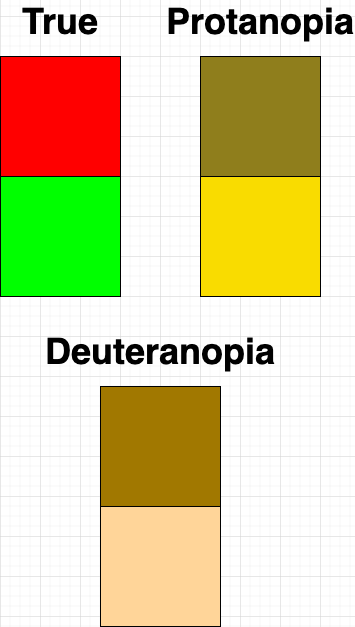
Protanopia (red-blind)
Deuteranopia (green-blind)
Tritanopia (blue-blind)
And more…
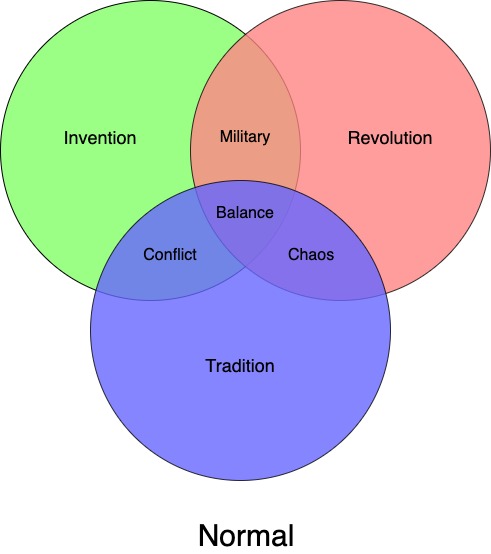
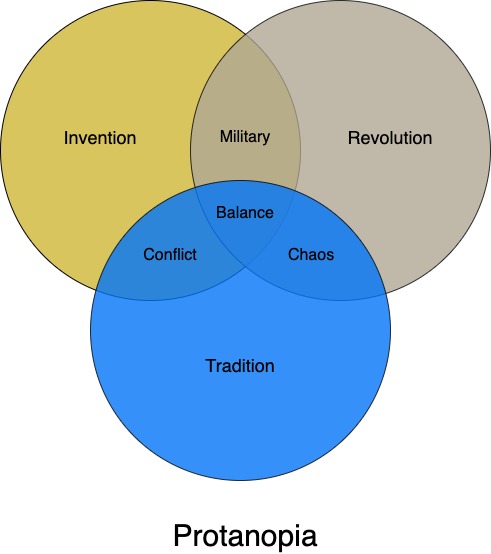
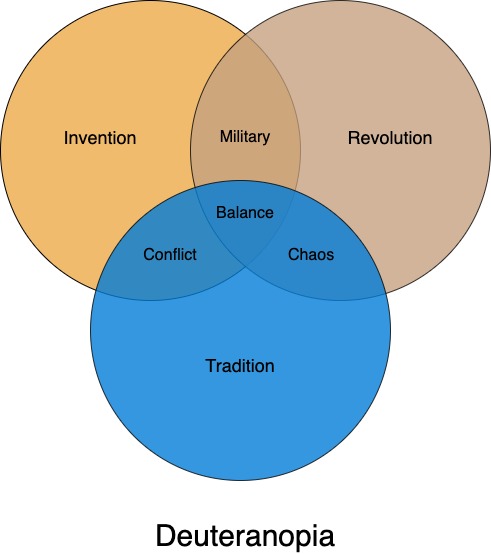
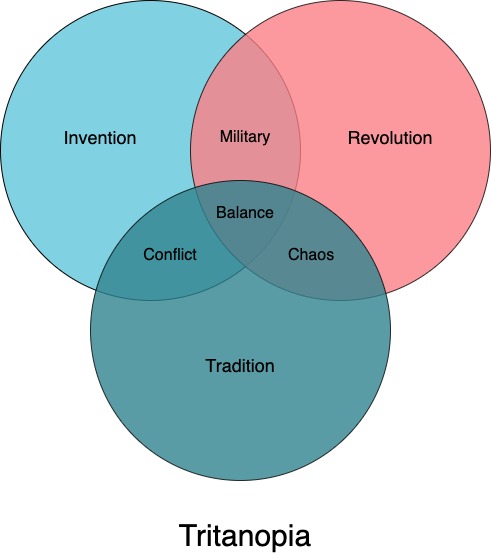
As you probably noticed in the picture above, something like red-blindness (protanopia) doesn’t just effect the color red. All colors that we see are made up of the three colors red, green, and blue mixed together in different proportions. That means that when we are unable to see one of these colors, the whole color spectrum is seen differently.
In other words, designing diagrams that are accessible to people with color blindness is not as simple as “avoid red and green”.
Choosing the right colors
Despite that, there are some general rules we can follow. The colors you choose will still look different to individuals with CVD, but the goal is to make sure that the colors contrast. This is especially important in diagrams, where you want the viewer to quickly distinguish between elements.
With that in mind, red and blue are the safest colors to use for your diagram, since they will always contrast, while green, and red-green combinations in particular, should be avoided. Even safer than red and blue, is good old black and white.
Still unsure which colors to choose? You can always use a colorblind-friendly palette, a number of which are available for free online.
Another way to differentiate elements is by using darker and lighter shades of the same color. This can be useful if you are already locked into certain colors that are not very accessible. If two similar colors are close together, try a stroke or outline around the elements to help distinguish them, and use dotted or dashed lines rather than colored lines.
Updating the colors of your shapes in draw.io is a simple way to make your diagrams more accessible. You can also go one step further and build a library of CVD-friendly shapes and colors that your entire organization can use, creating a standard for accessibility.
Make your diagram iconic
If colors are your only way to show different information, your diagram might be hard to read – not just for people with color blindness, but for any audience. You should make full use of different shapes, icons, symbols, and text. Luckily, draw.io has a rich library of shapes and icons, and you can also upload your own.
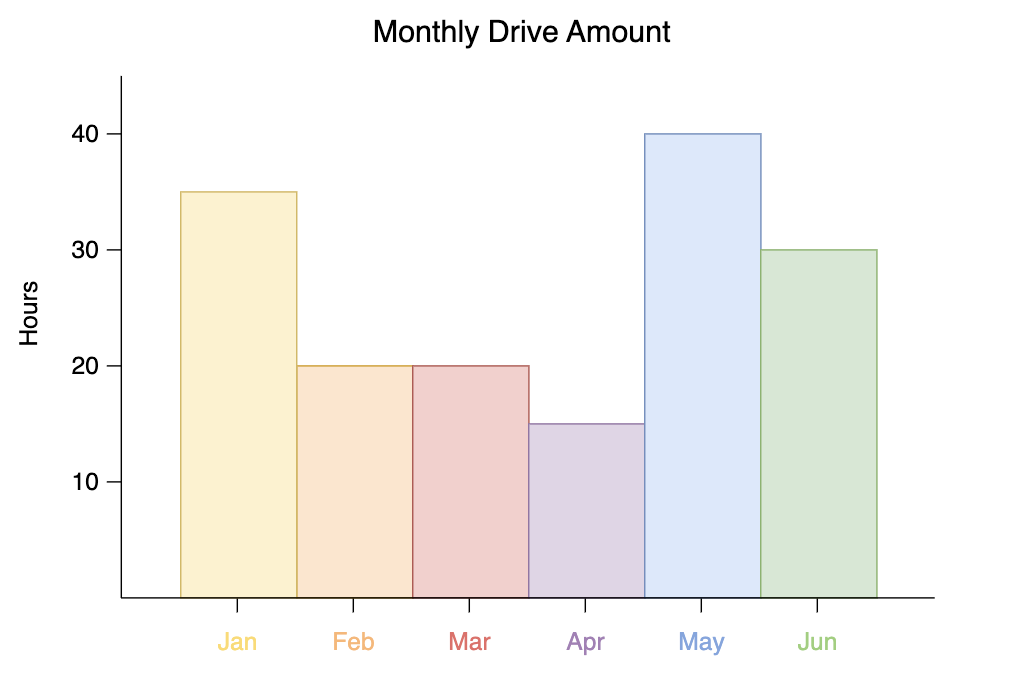
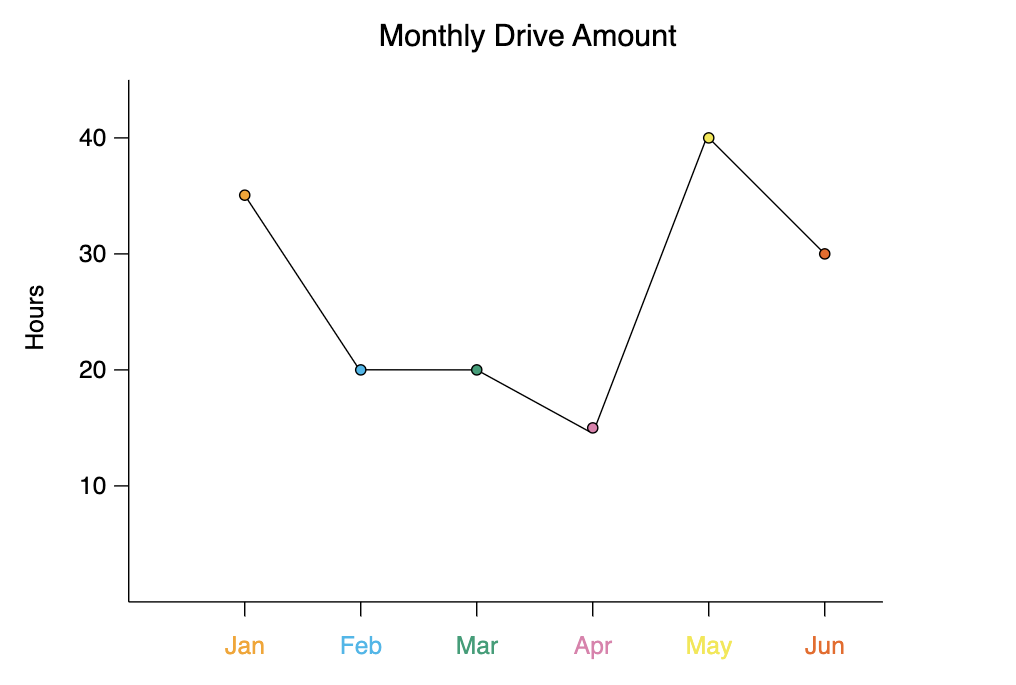
When designing for CVD accessibility, you may also want to consider if color is a key aspect of a specific kind of chart, and if there is an alternative chart that doesn’t rely so much on color. Think for example of bar charts and heat maps, where color is often the main visual identifier of the information. Can you replace these charts with some other kind of diagram like a line graph or dot matrix that is easier to distinguish without color?
Use visualizer tools
Today there are a ton of tools to help you better understand CVD and design accessible diagrams. Several websites offer simulators which show you what an image looks like to people with different kinds of color-blindness. You can easily export your draw.io diagram as a .JPEG or .PNG file, upload it to these websites, and see just how accessible it is:
The Chrome extension Spectrum shows you your web-browser in different CVD modes, so you can test your diagrams while working on it in Confluence. Another website offers a handy color picker that allows you to select a color and see how it would appear to people with different kinds of CVD.
There are more resources and more information than ever to create visuals that are accessible to those with colorblindness. Ultimately, the principles of making your diagram CVD-friendly – choosing colors that are easy to read, making use of different shapes and strokes, and above all, trying to better understand your audience – are the principles behind making any good diagram.
You are currently viewing a placeholder content from Youtube. To access the actual content, click the button below. Please note that doing so will share data with third-party providers.
More InformationDo you like to dive deeper into the world of draw.io? Access our linktr.ee page to follow us on Social media and learn how others use draw.io and hopefully pick up some tips and tricks.
You don’t use draw.io yet? Convince yourself and start your free 30-day evaluation today. Or book a free no-obligation demo with our customer success team to learn more about how draw.io can make life easier and more productive for you and everyone in (and outside of) your company!
Happy diagramming!
Last Updated on April 26, 2023 by Admin