In business, there are many diagrams that illustrate complex relationships. The initial diagram can be overwhelming, especially if you don’t know the processes or information that are represented.
Being able to explore a complex diagram, step-by-step, looking at each component and its relationships in context, can let you understand the entire diagram much more quickly.
A hidden feature in draw.io lets you do exactly this.
Create an interactive, animated, automated diagram
When you publish to a URL, a dialog with an incredibly long URL is displayed (it’s shorter when you publish a diagram saved in Google Drive).
Add &p=ex to the URL somewhere close to the beginning, as highlighted in grey in the following image, to turn your complex and static relationship diagram into an interactive diagram.
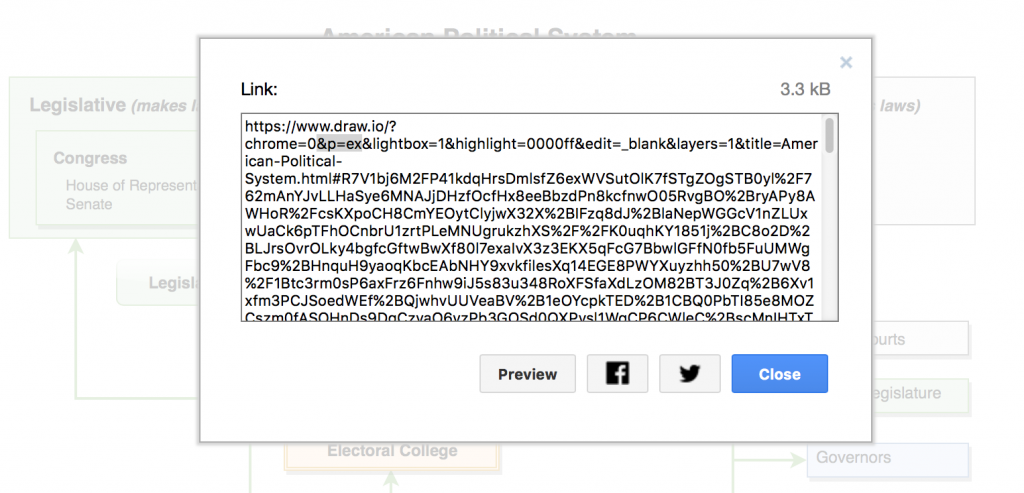
draw.io diagram published to URL with an extra option added, highlighted in grey, to enable an interactive, animated and automated view.
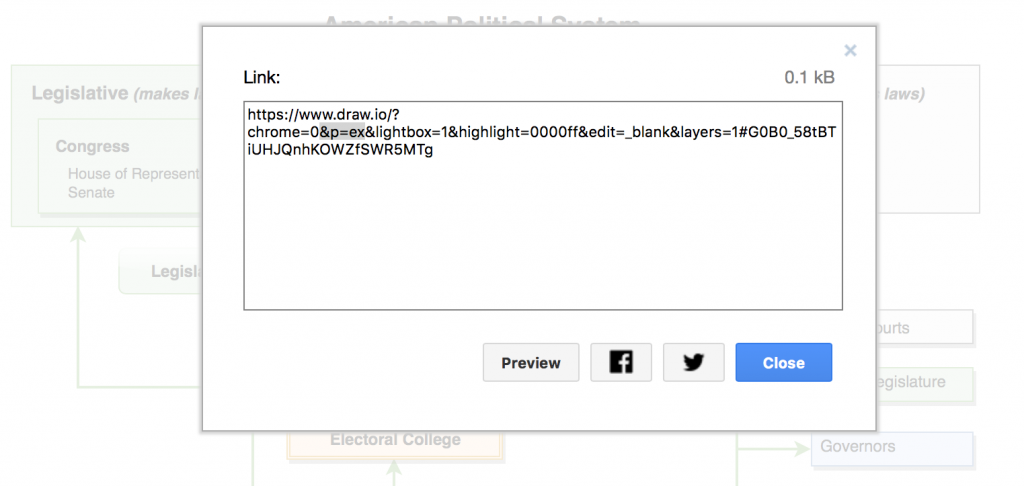
draw.io URLs are shorter when saved to Google drive.
By publishing or exporting the diagram to a URL, and simply adding this short snippet of text into the address, you can create your own interactive, animated, and automated diagram.
You are currently viewing a placeholder content from Youtube. To access the actual content, click the button below. Please note that doing so will share data with third-party providers.
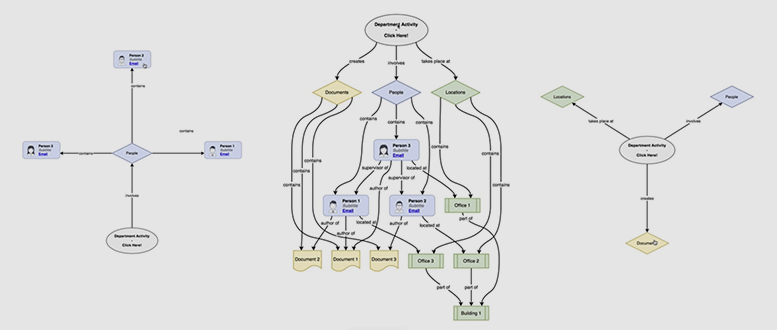
Viewing relationships in a complex diagram
The following animation illustrates how you can manipulate the interactive diagram and look at the relationships of each component.
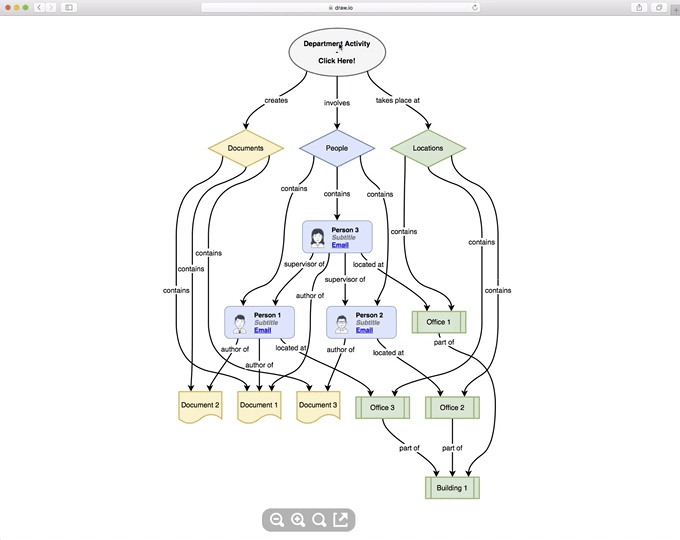
- Starting at the top of the diagram, and clicking on Department Activity, you can see it is connected to Documents, People, and Locations.
- Click on People to see the three staff members, then on Person 2, to see who his supervisor is, where he is located, and what document he has authored.
- When you click on Document 3, you see it is included in the Documents store, and has only that person as the author. To see what other documents are available, click on Documents.
- You can get back to Department Activity from here, and continue to explore your diagram.
You are welcome to experience for yourself, how this particular diagram works, as it has been published to a public URL.
Where to use this hidden feature
There are a number of situations in which this feature would be useful.
- To explain a complex hierarchy during the on-boarding of a new employee in a large corporation.
- To illustrate a complex computer network in an organization.
- To show where elements are re-used in single-sourced technical documentation.
- To document the relationships and dependencies between data structures when designing new or extending existing software.
Where else could you use this feature?
Last Updated on April 17, 2020 by Admin