Driving positive change
For administrators, improvement teams, and medical professionals in general, identifying an improvement goal and all the factors that will positively influence this outcome is crucial for improving systems already in place.
These systems can be on a micro level, such as changing a specific medical process or proposing change within one organization, or on a macro level, e.g. effectuating change in a number of organizations across regions or even countries. Whether you’re working on changing a micro-level or macro-level system, it’s key to understand how the components within the system depend on and influence each other.
Whatever change you are looking to influence, you want to implement specific strategies to achieve the goal set. Driver diagrams are the established method to define your system and visualize the change process. They achieve this by highlighting the causal relationships that influence the goal.
Working with driver diagrams
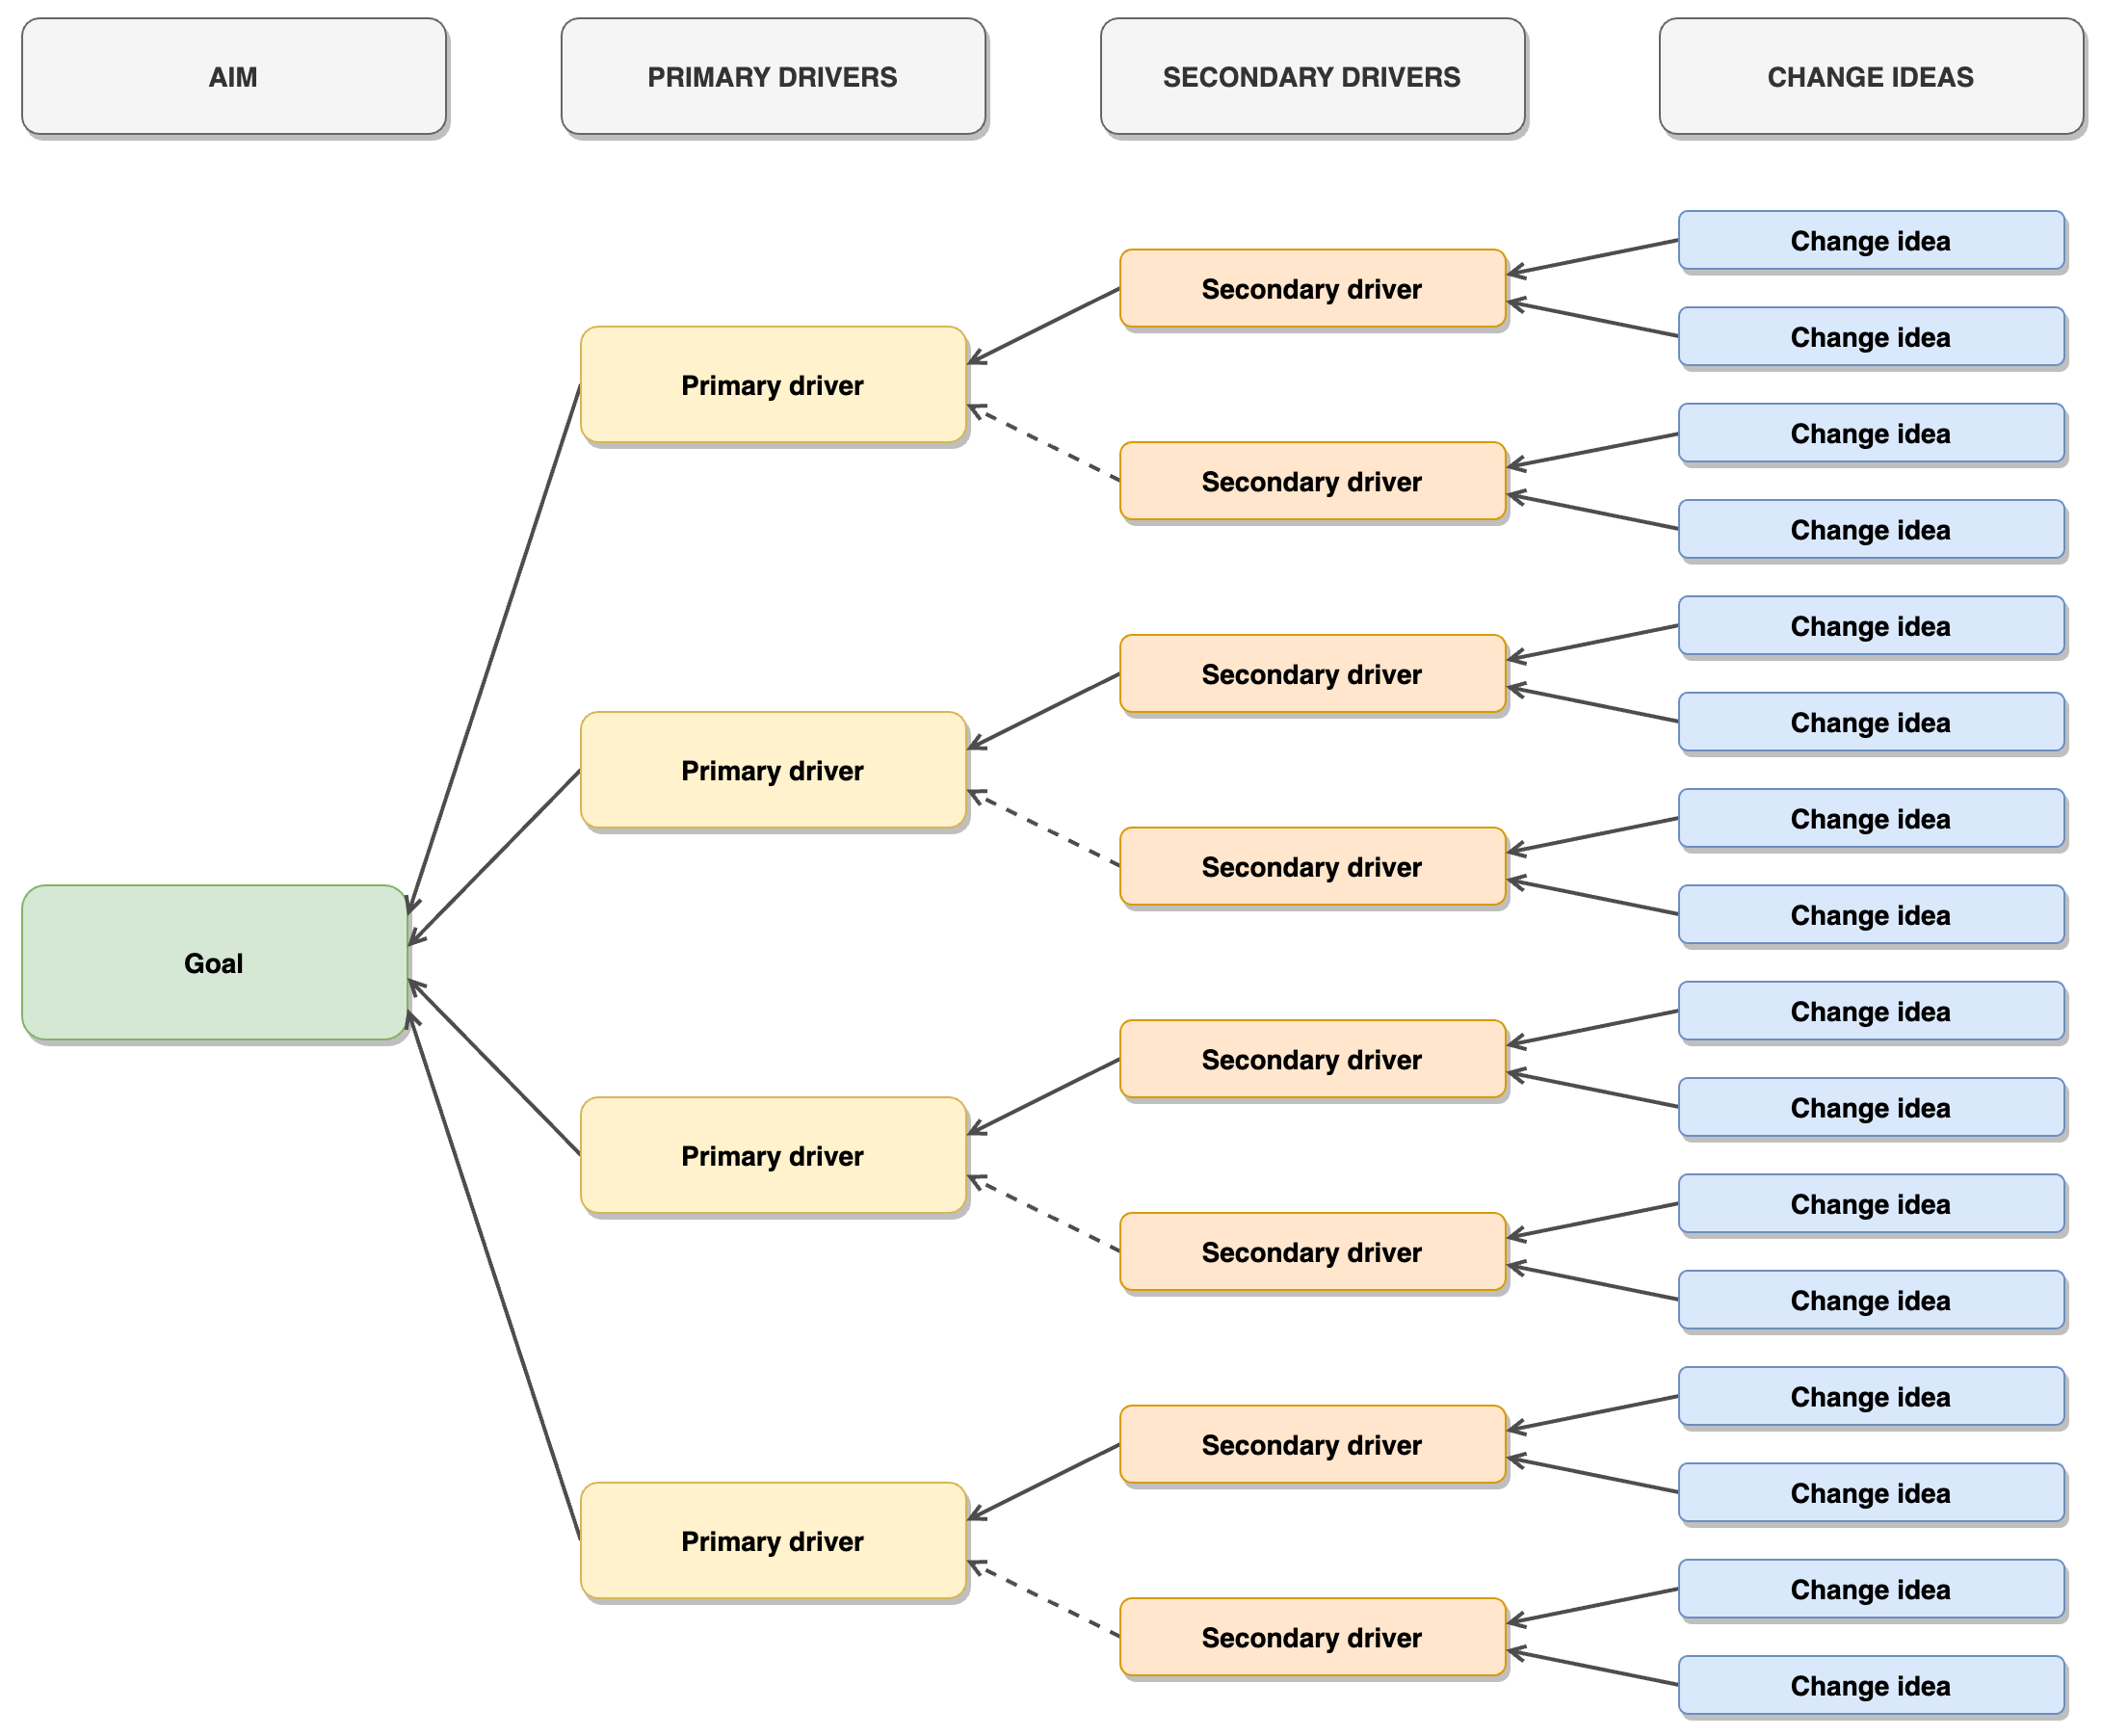
Driver diagrams consist of the following:
-
The goal i.e. the outcome you are looking to achieve. This goal is driven by:
-
- Primary drivers: a small number of factors that you believe will cause the outcome to occur.
- Secondary drivers: even smaller factors that influence the primary drivers.
- Change ideas: the projects or activities to put in place that will contribute to the primary and secondary drivers, and will result in improving the system overall.
These are the fundamental steps, but further layers can be added to the process where necessary, e.g. tertiary drivers, depending on the complexity of the system.

- Open Confluence.
- Open draw.io (blank diagram).
- Drag & drop your XML file into your blank drawing area.
- Use it as a custom template if you like.
The process
Start with your “why” and set your goal
Make sure the goal is something that is well-defined, measurable, and most importantly: realistic.
For example, “To improve the efficiency of healthcare provision at [organization]”, is too broad and would need to be narrowed down. Setting a SMART goal can help with this. Applying SMART criteria, we could rewrite our goal as, “To reduce the average waiting time in [department] at [organization] to [x] weeks by [date].”
Having a more specific goal allows us to benchmark against the current average waiting time. It also means that by the deadline we have set, we can see if the measures we’ve put in place have positively contributed to achieving, or being closer to achieving, our average waiting time goal.
Once your goal is set, it’s time to think about the drivers that will influence this.
Consider the potential drivers
What needs to be improved, in order to achieve this goal?
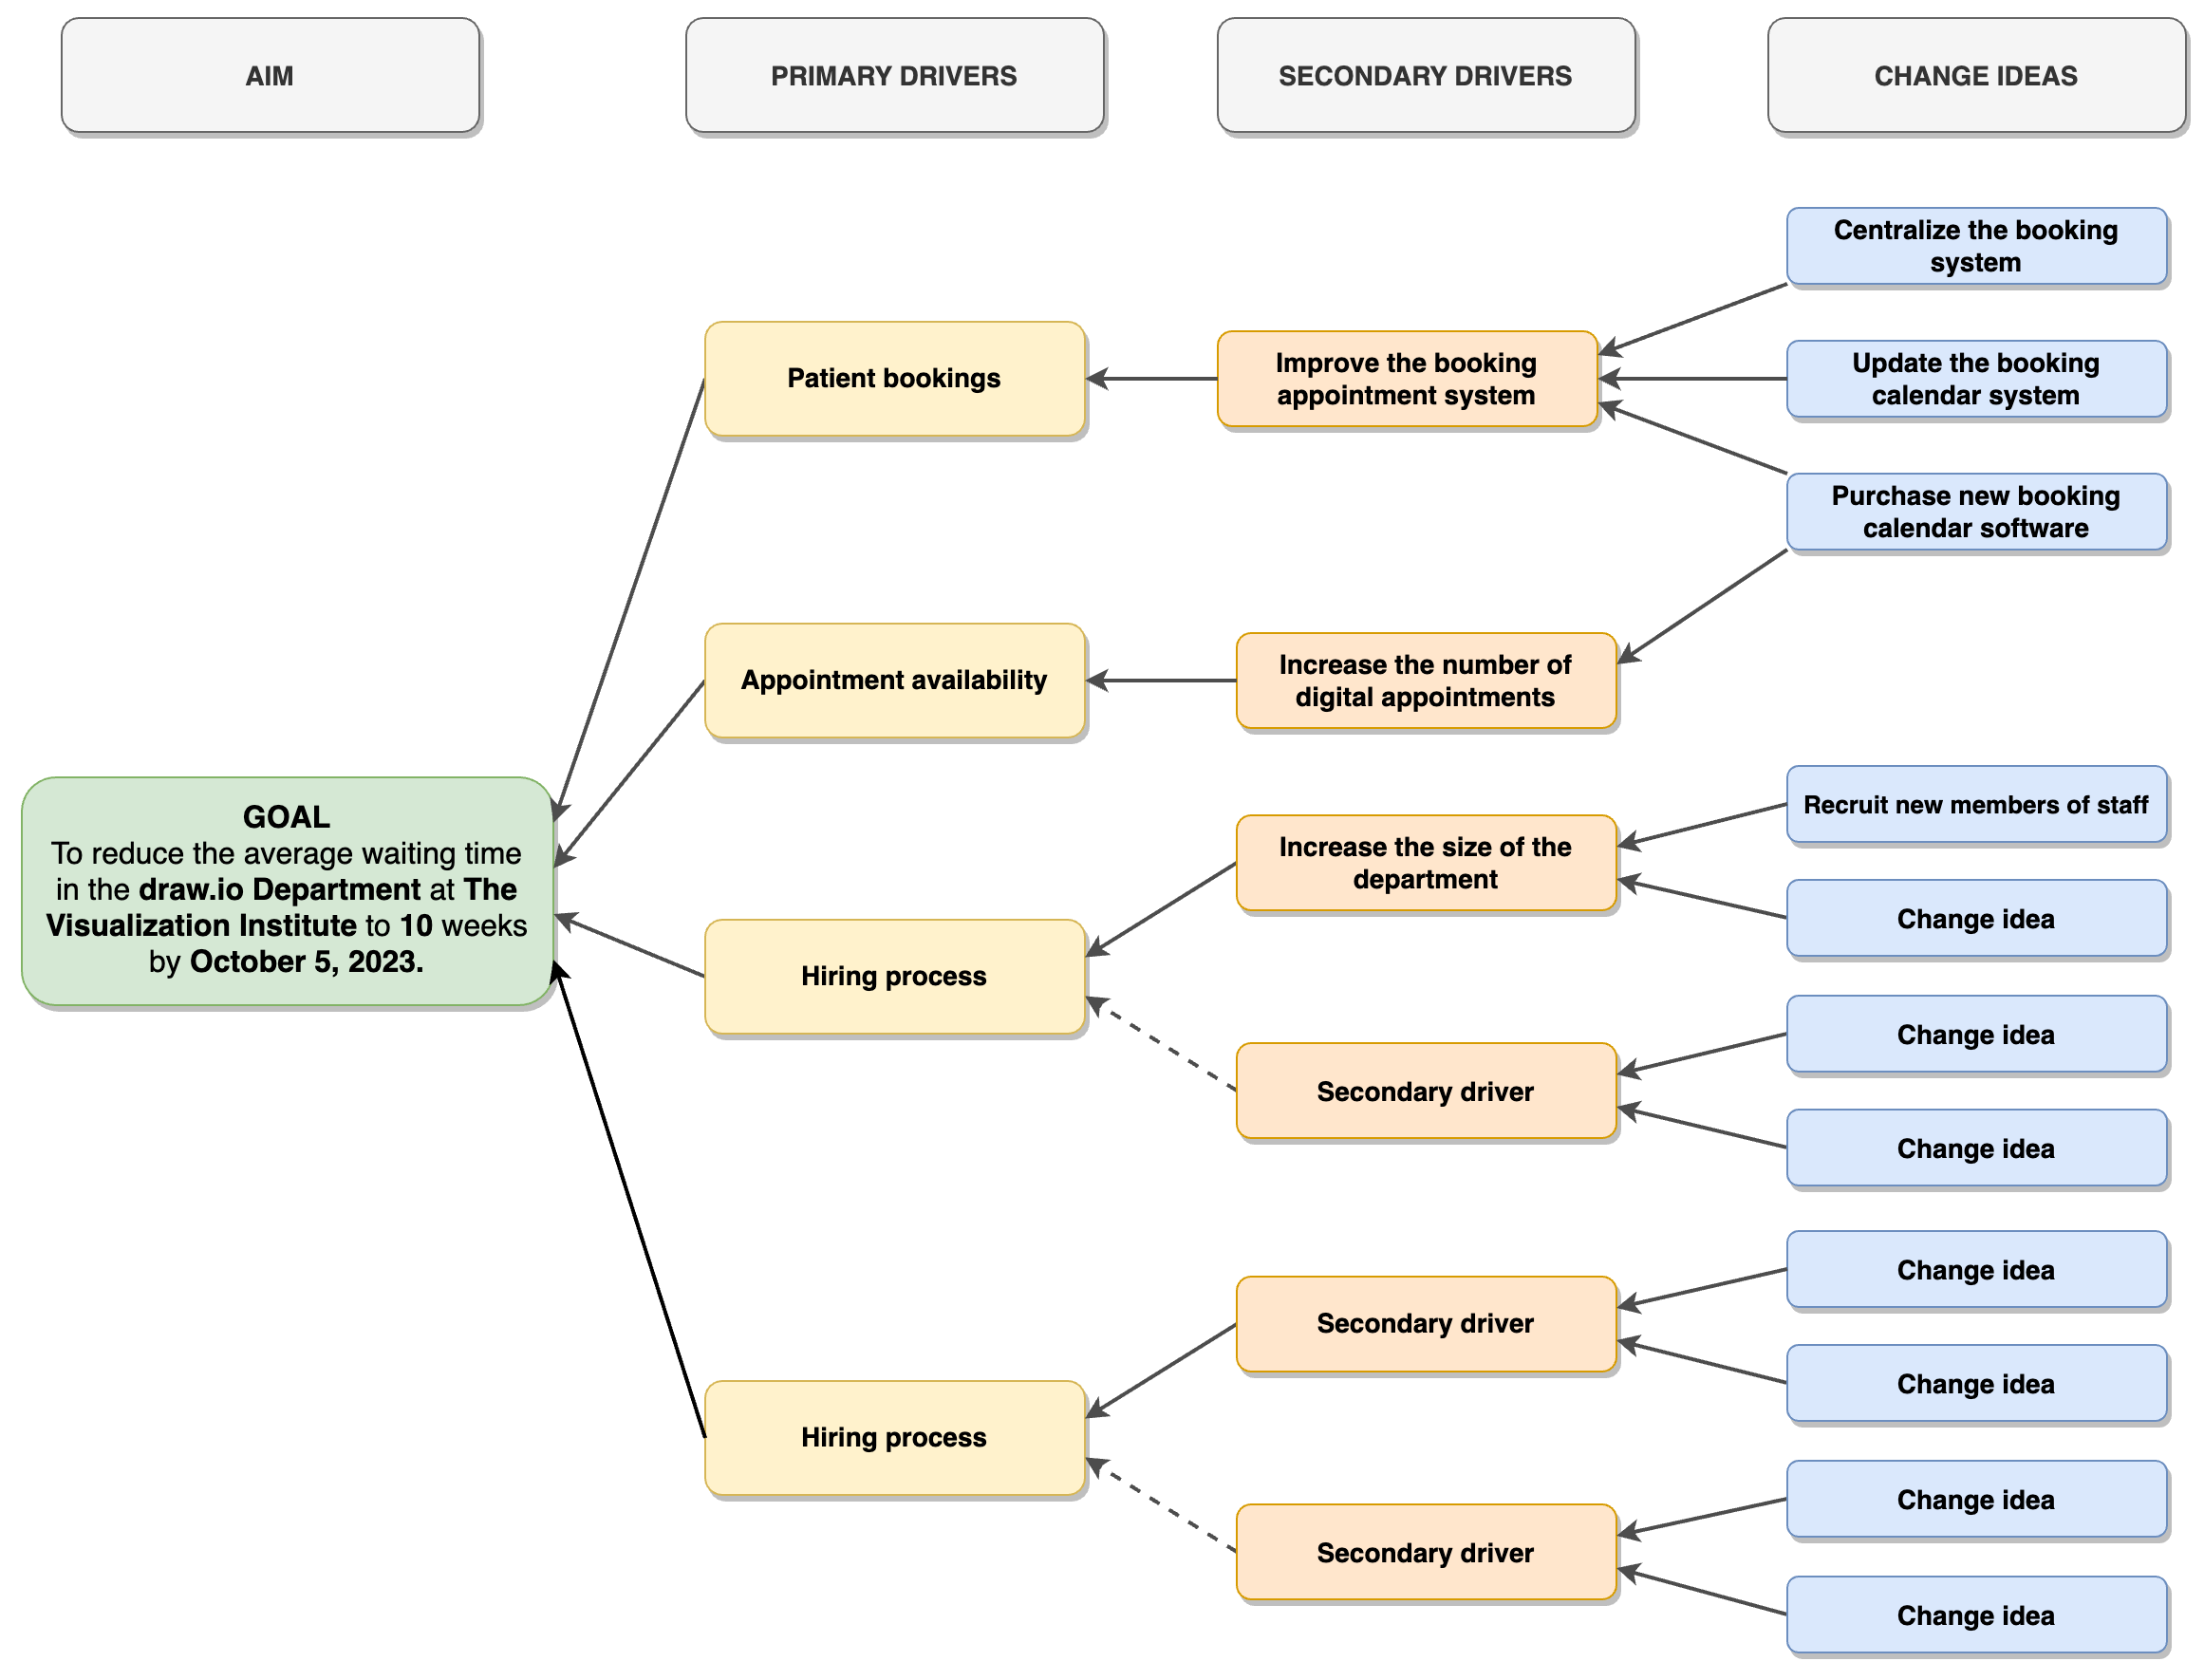
Continuing with the above scenario, primary drivers might include: patient bookings; appointment availability, and the hiring process. Drawing on these themes, secondary drivers might be: improve the booking appointment system, increase the size of the department, and so on.
To keep everything in one place, you can add a new page to your driver diagram to capture your and your team’s ideas for a list of potential drivers. That way, anyone accessing the driver diagram can see the outcome of the original brainstorming process and how the drivers were selected:
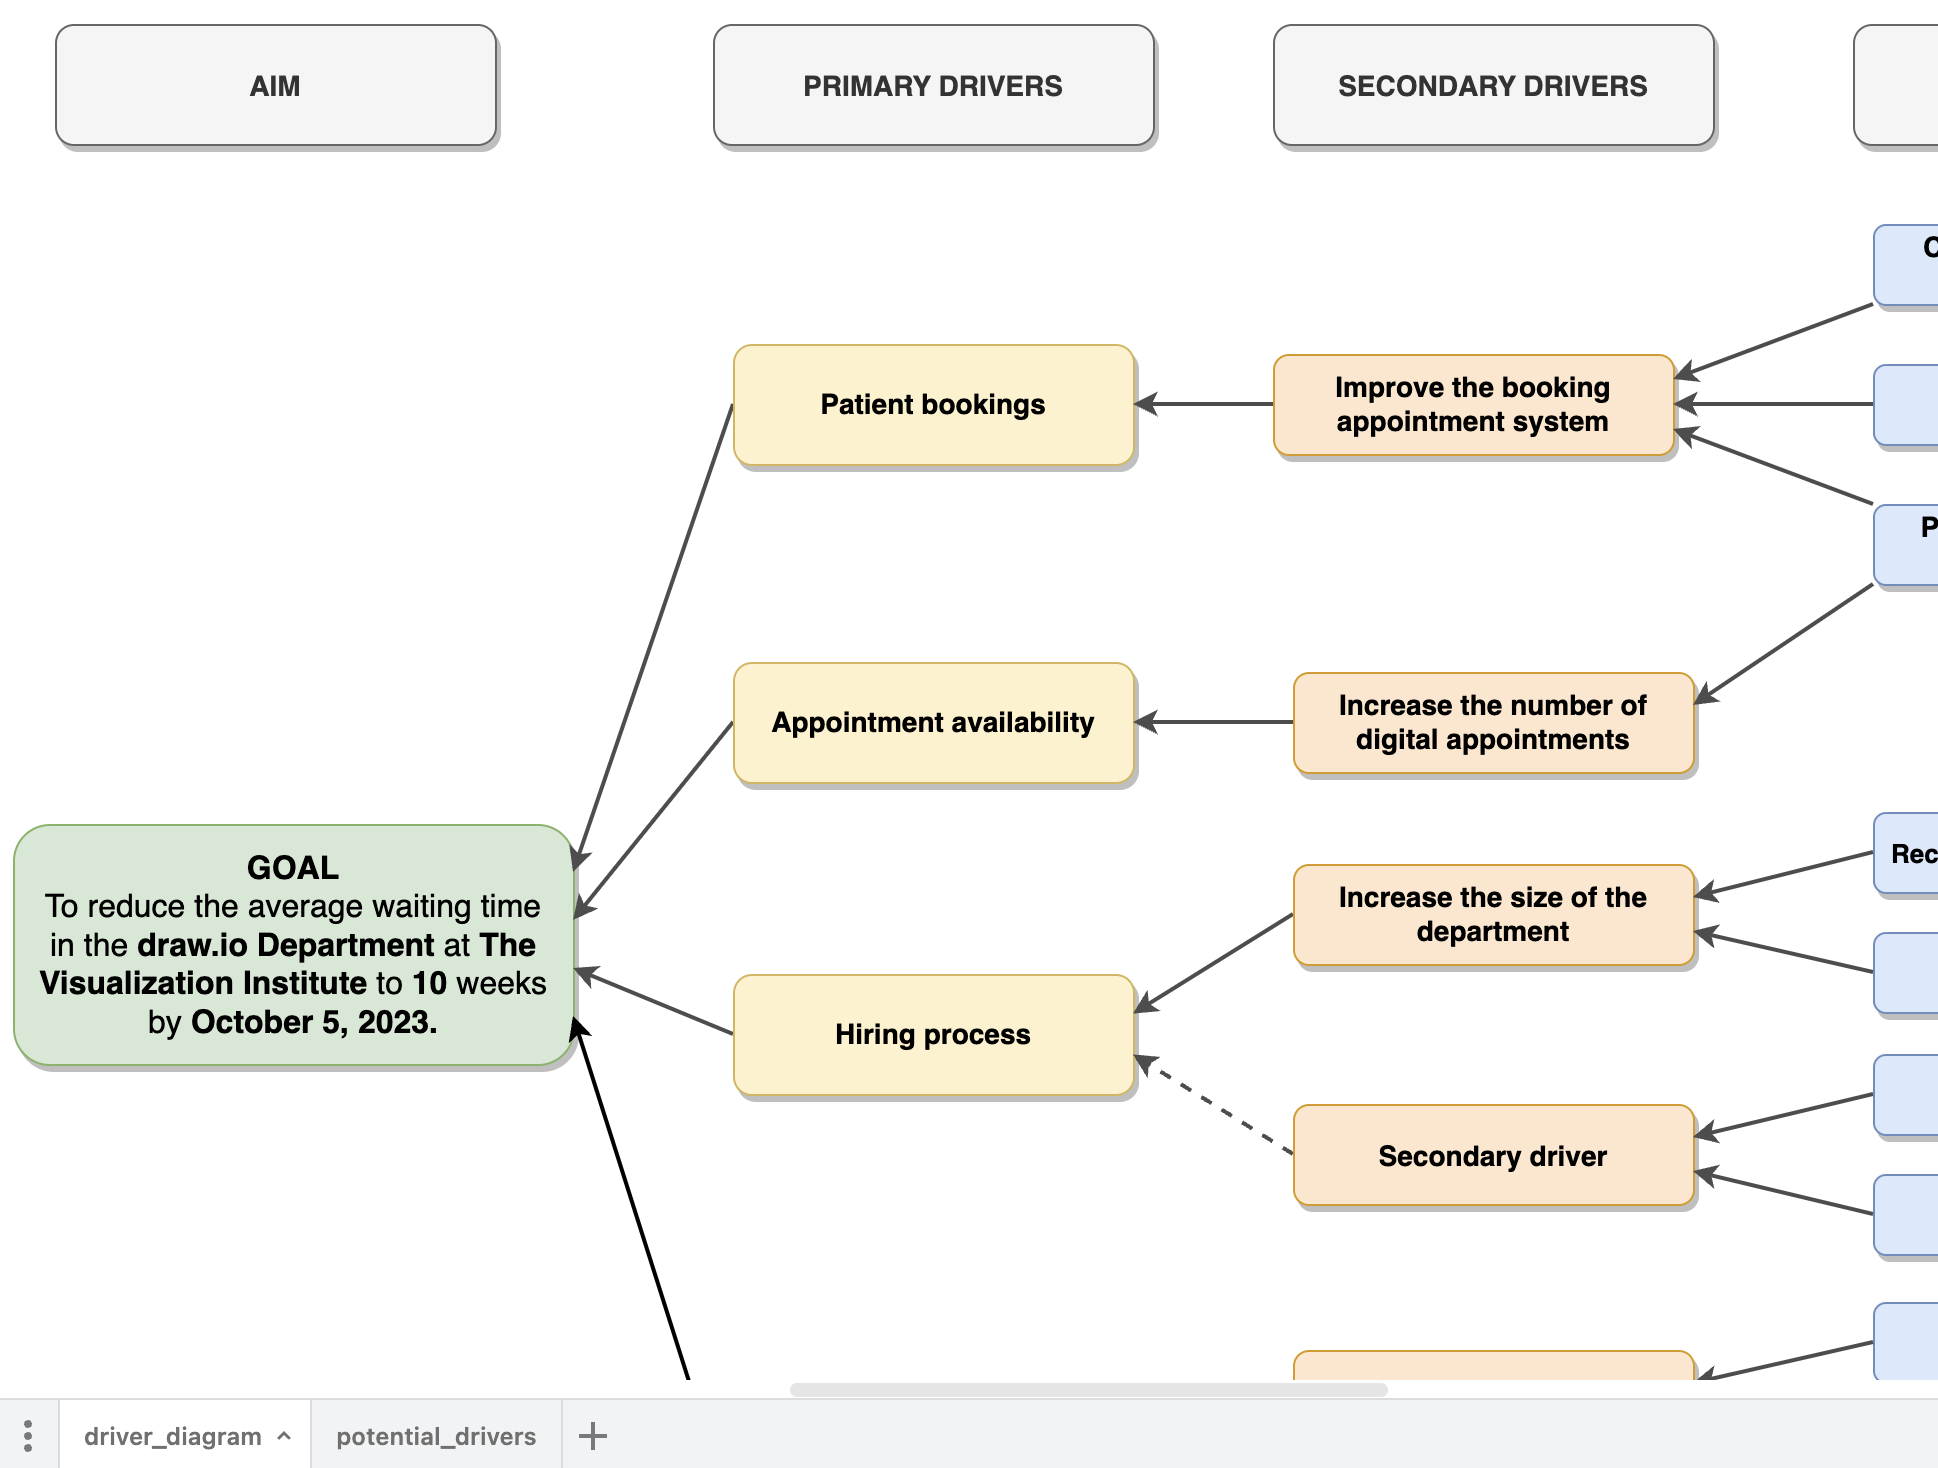
Page 1: finalized driver diagram
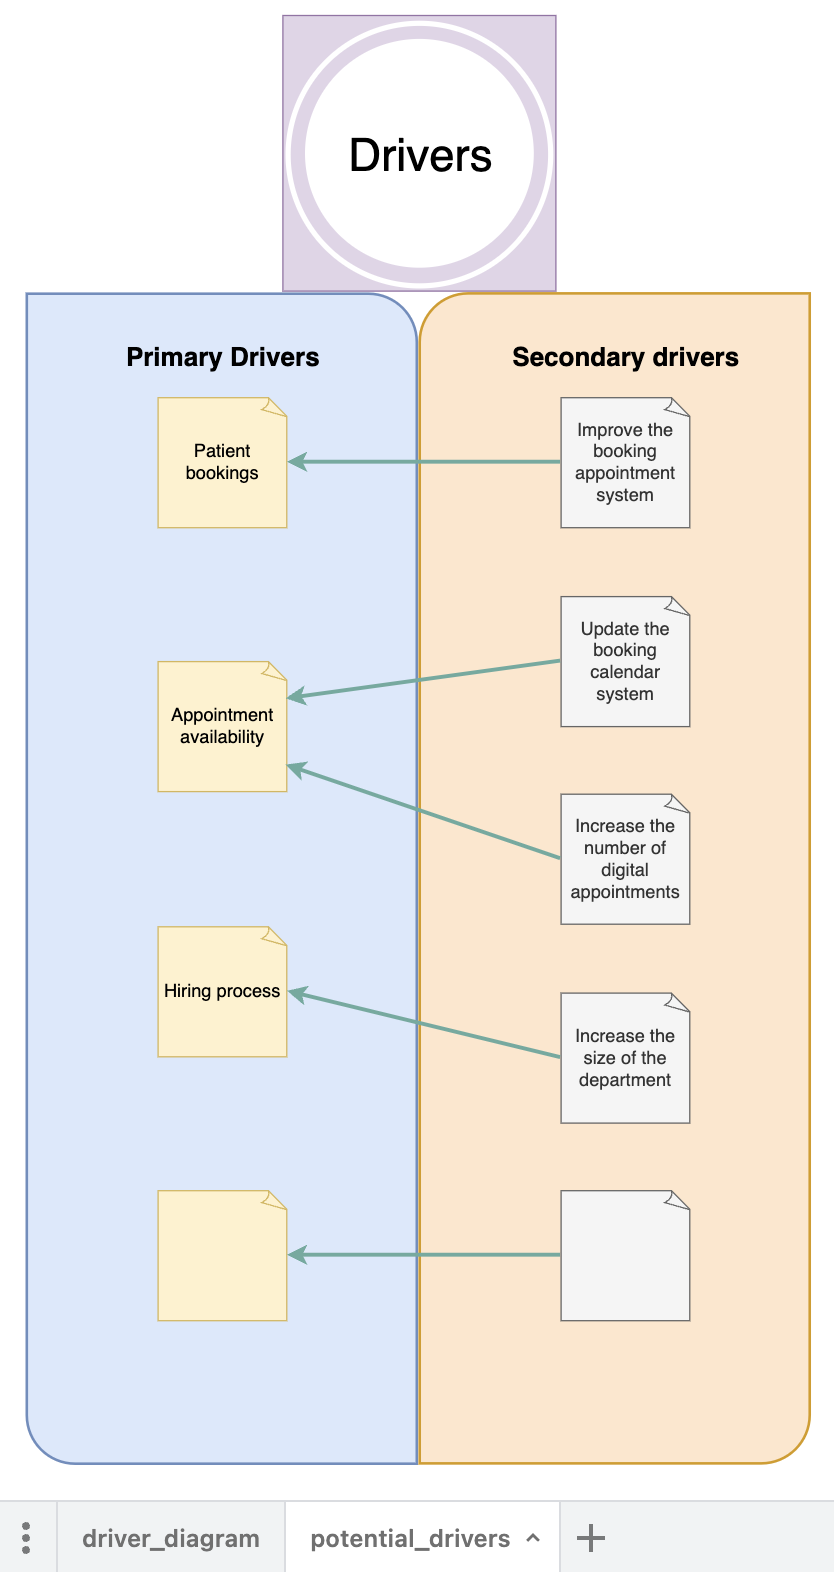
Page 2: brainstorming potential drivers
Once you’ve mapped out all of your drivers, see if there are any commonalities where you can group ideas together into a single driver. Like with the goal, you want drivers to be well-defined, and ideally measurable.
Think about your change ideas
Change ideas can be activities or projects. These are the actions that will drive the change you want to see, and that you believe will contribute to reaching the goal.
With the driver, “improve the booking appointment system” for example, a change idea could be “centralize the booking system”. While this change idea will need to be broken down further to specify who is going to centralize the system, how, and by what date, this is a concrete activity that will influence the corresponding driver.
Visualize your driver diagram
You are now ready to add your drivers and change ideas to your driver diagram, along with the links between the different sections.
By allocating primary, secondary, and even tertiary drivers in your diagram, you will gain a clearer view of which actions to prioritize that will most likely help you achieve your goal.
Helpful tips when customizing your connectors
The following features are useful when customizing the connectors in your driver diagram:
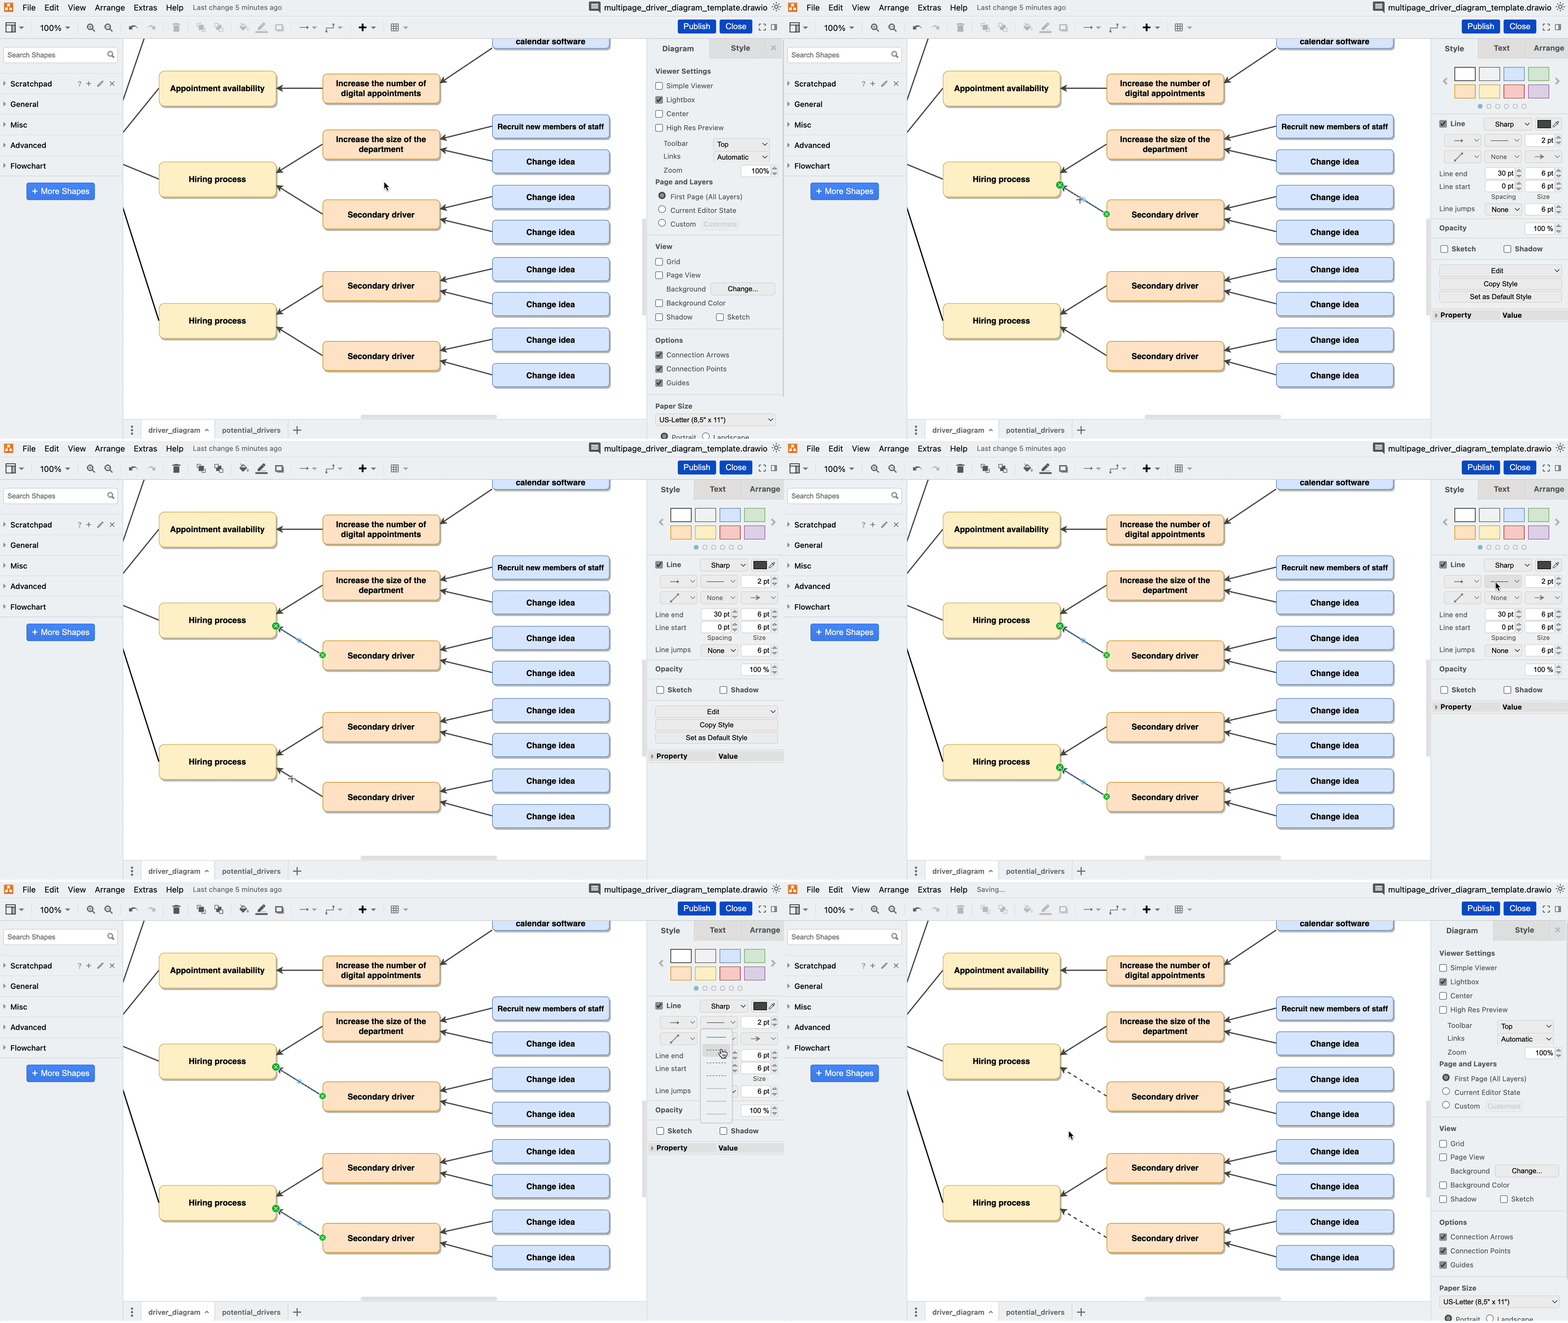
Choose between dashed and solid connectors
Solid connectors indicate a strong relationship between components, whereas dashed connectors indicate a weaker relationship.
To change a connector line type, click on the connector, or hold down Ctrl (Windows) or Cmd (Mac) to select multiple connectors, click on the Pattern option, and choose the line type you wish to use.
Change the connector endpoints
Driver diagrams can be read from right to left, from “cause”, (the change ideas and drivers), to “effect”, (the goal or aim). The connectors between the goal and drivers often, (but not always), have arrowheads indicating this right-to-left direction of cause and effect: the secondary drivers feed into the primary drivers, and the primary drivers feed into the overarching goal.
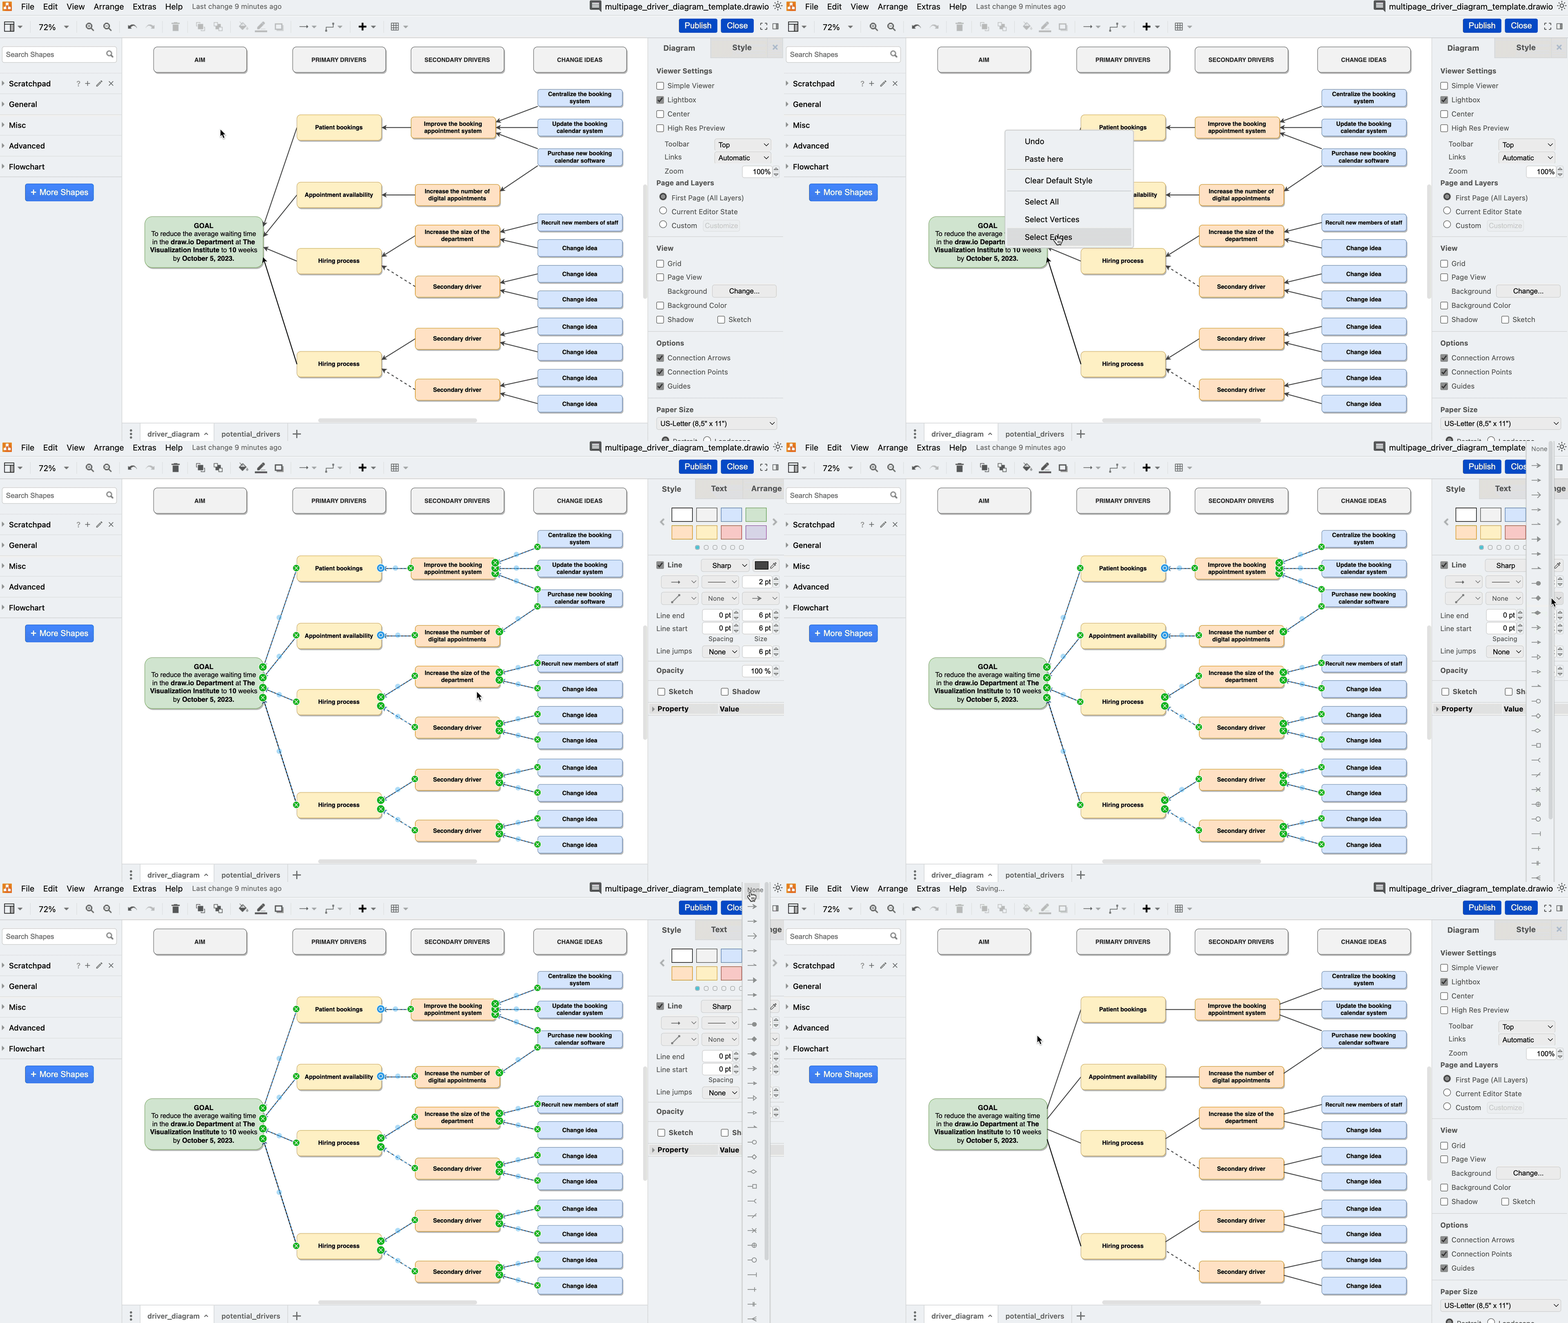
If you want to remove all the endpoints in one go:
- Select all connectors by either:
- right-clicking on any blank space in the editor and click on Select Edges, or
- pressing Ctrl+Shift+E (Windows) or Cmd+Shift+E (Mac);
- then click on the Line End option, and choose None from the top of the dropdown menu.
Change the waypoints
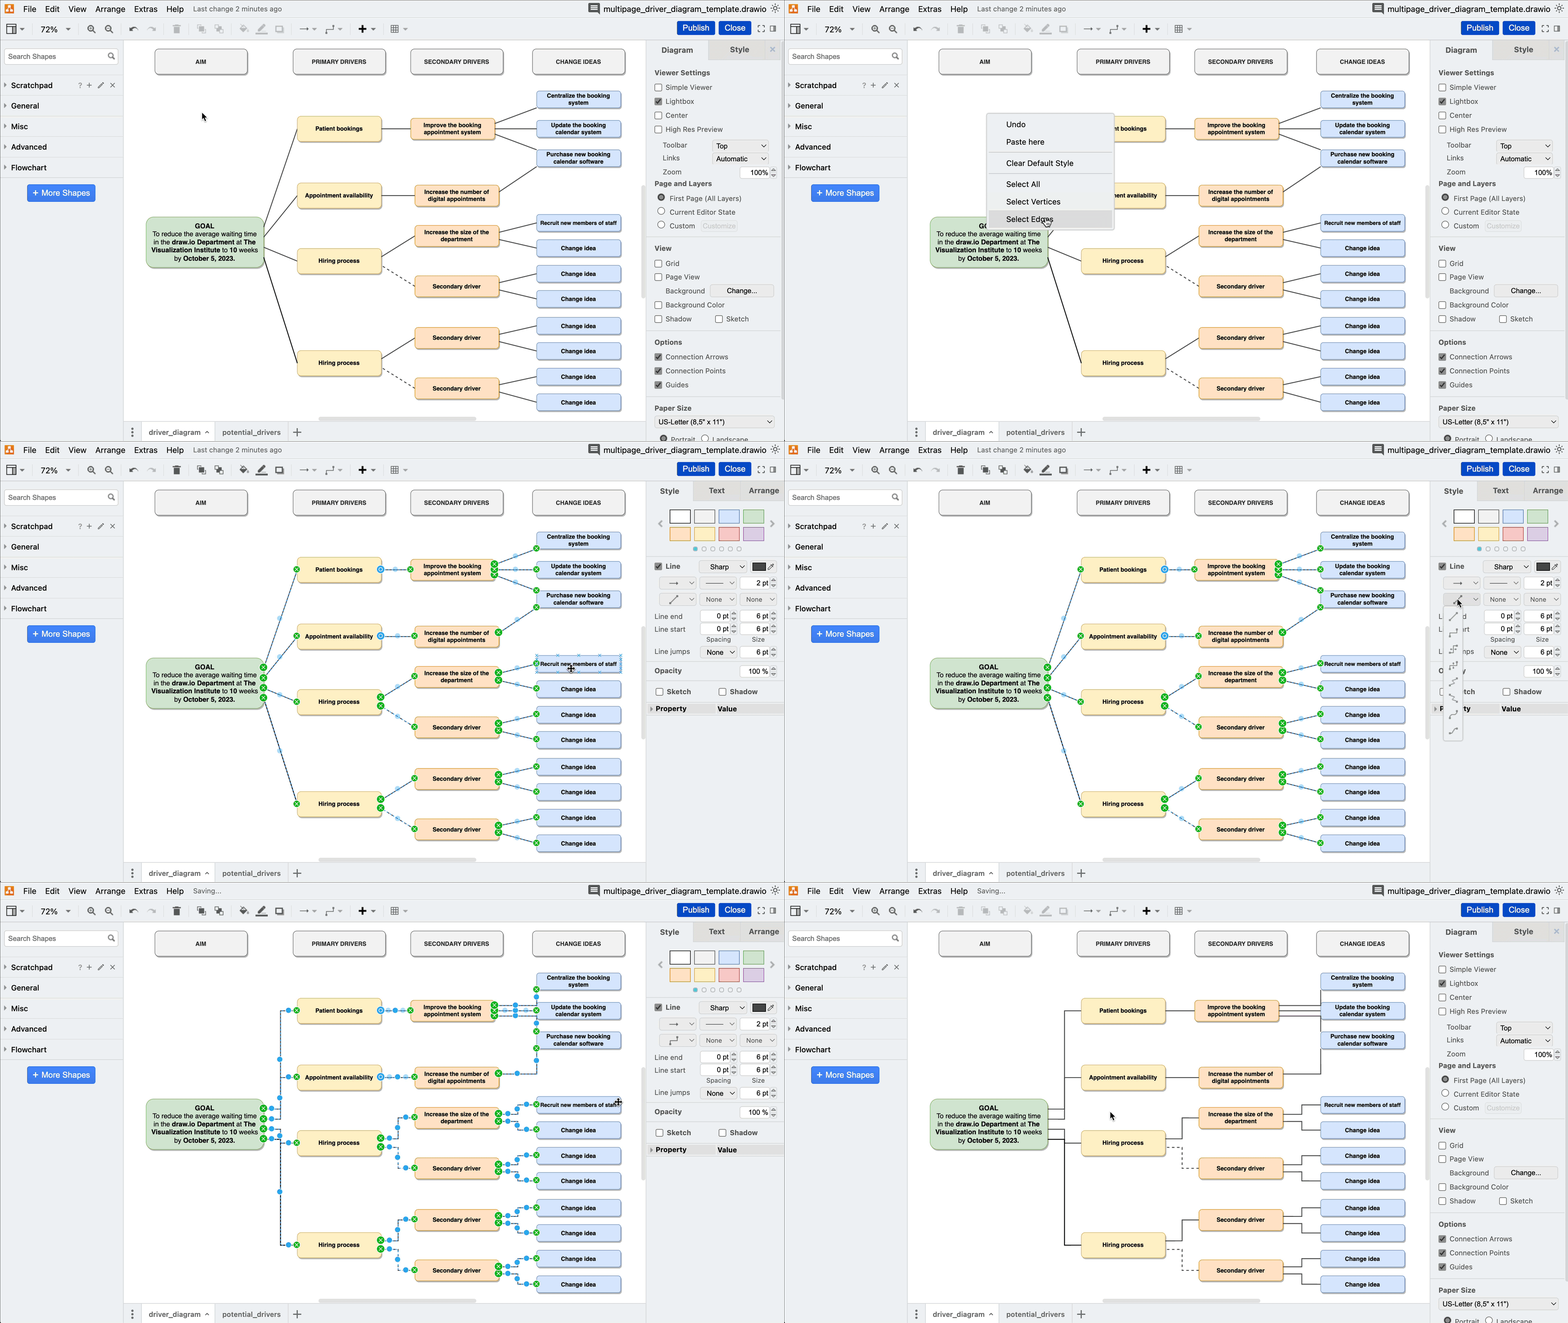
If instead of diagonal straight lines between the connections, you prefer orthogonal (great word, right?) aka right-angled lines between concepts: select all connectors using Ctrl or Cmd+Shift+E, head to Waypoints, and select the second option from the dropdown menu.
Customize your connection points
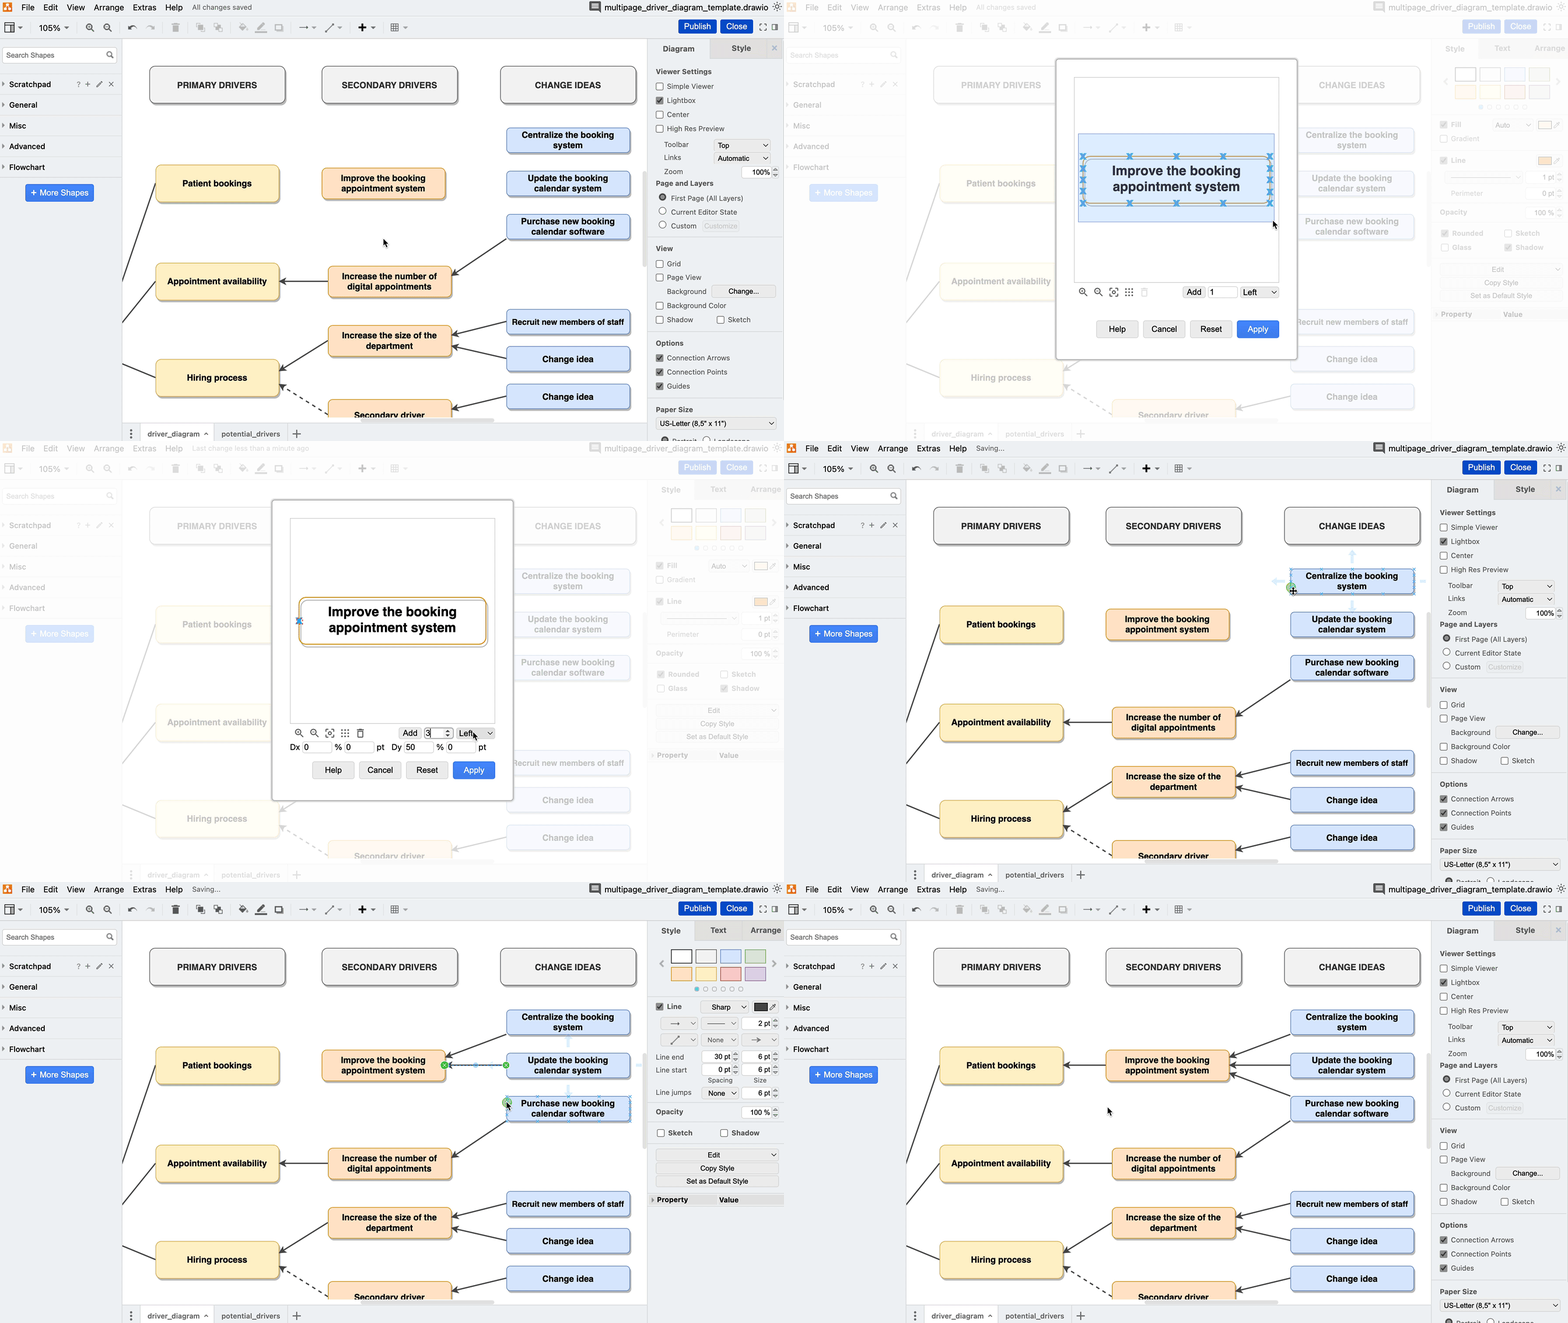
Customizing your connection points gives you complete flexibility: you can add connection points anywhere you want to on a given shape for your connectors to attach to. This also tidies up your diagram by evenly distributing your connectors going to and from a particular shape, depending on how many connection points you need for each side.
To change the connection points:
-
Right-click on a shape and select Edit Connection Points…
-
In the edit connection points modal you can then choose to delete each connection point individually, or delete them in bulk:
-
To delete an individual connection point, click on the point, then click on the trashcan icon.
-
To delete multiple default connection points, click and drag your mouse over some or all of the connection points, and then click on the trashcan icon.
-
-
In the number field, type in how many connection points you want for a side of the shape, and click Add, to apply the changes. Repeat this step for each side of the shape you want connection points for.
-
Once you are done, click Apply. You can then drag your connector endpoints to your custom shape connectors.
Be in the driver’s seat
Want to “drive” deeper into the world of draw.io? Access our linktr.ee page to follow us on social media and learn how others use draw.io, as well as pick up some helpful tips and tricks.
Not using draw.io yet? Convince yourself and start your free 30-day trial today. Or book a free no-obligation demo with our customer success team to learn more about how draw.io can make life easier and more productive for you and everyone in (and outside of) your company!
Happy diagramming!
You are currently viewing a placeholder content from Youtube. To access the actual content, click the button below. Please note that doing so will share data with third-party providers.
More InformationLast Updated on November 20, 2023 by Admin

