Every great quest needs a map, whether it’s found at the beginning of the book, or in the menu of your favorite video game. This is as true for your customers as for any hero rescuing his princess. A customer journey map serves as a visual representation of the customer’s path when interacting with your company and brand. Every purchase is just one stage in a longer journey, and mapping that journey helps us to analyze user behavior, understand their pain points, and gain insights into potential friction as they interact with the brand. This in turn allows us to optimize the customer experience, smoothing their way along the path.
It’s dangerous to go alone, but don’t worry, draw.io has all the pieces you need to build a customer journey map in Confluence.
Getting ready to build your map
Before you start designing your customer journey map, you’ll need to do some prep work. Of course, you need to know the objective of your map, whether you are mapping the current customer experience, or the experience you plan to create in the future. You’ll need to perform research on real customers and analyze data from your website, paid ads, social media etc., to understand how customers interact with your brand. A big step will be creating buyer personas, so you know exactly whose journey you are mapping and what their needs are. Once you have all the information at hand, you’ll be read to create your map. For the purpose of the article, we’ll assume you’ve already done that work and are ready to start putting it all together.
Designing a customer journey map in draw.io
A customer journey map can be a simple matrix, or a more complex chart with icons, branded colors and an appealing design. Both are possible with draw.io, and for our example, we’ll create something a bit more visually interesting than a simple grid. To start, let’s open a blank canvas in draw.io.
1. Add your persona
Each customer journey map corresponds to a specific customer persona, so it makes sense to have the details of that persona somewhere near the top. To create a space for this user description, drag a rectangle shape from the left-hand menu and size it to the dimensions of your chart. Don’t worry too much about the exact width at this point – it’s easy to resize your diagram at any time by moving and resizing shapes. The color and stroke of shapes can be changed from the right-hand menu.
Next we’ll add an icon to represent our persona. A quick search for “person” or “user” in the left-hand search bar will bring up several options. If you already have a custom image to represent your persona, you can import it into draw.io by dragging and dropping the file onto the drawing canvas. To add text, simply click on a shape and start typing, or double-click anywhere on the canvas to add a text box.
(image of just the persona section of the customer map being created on the canvas)
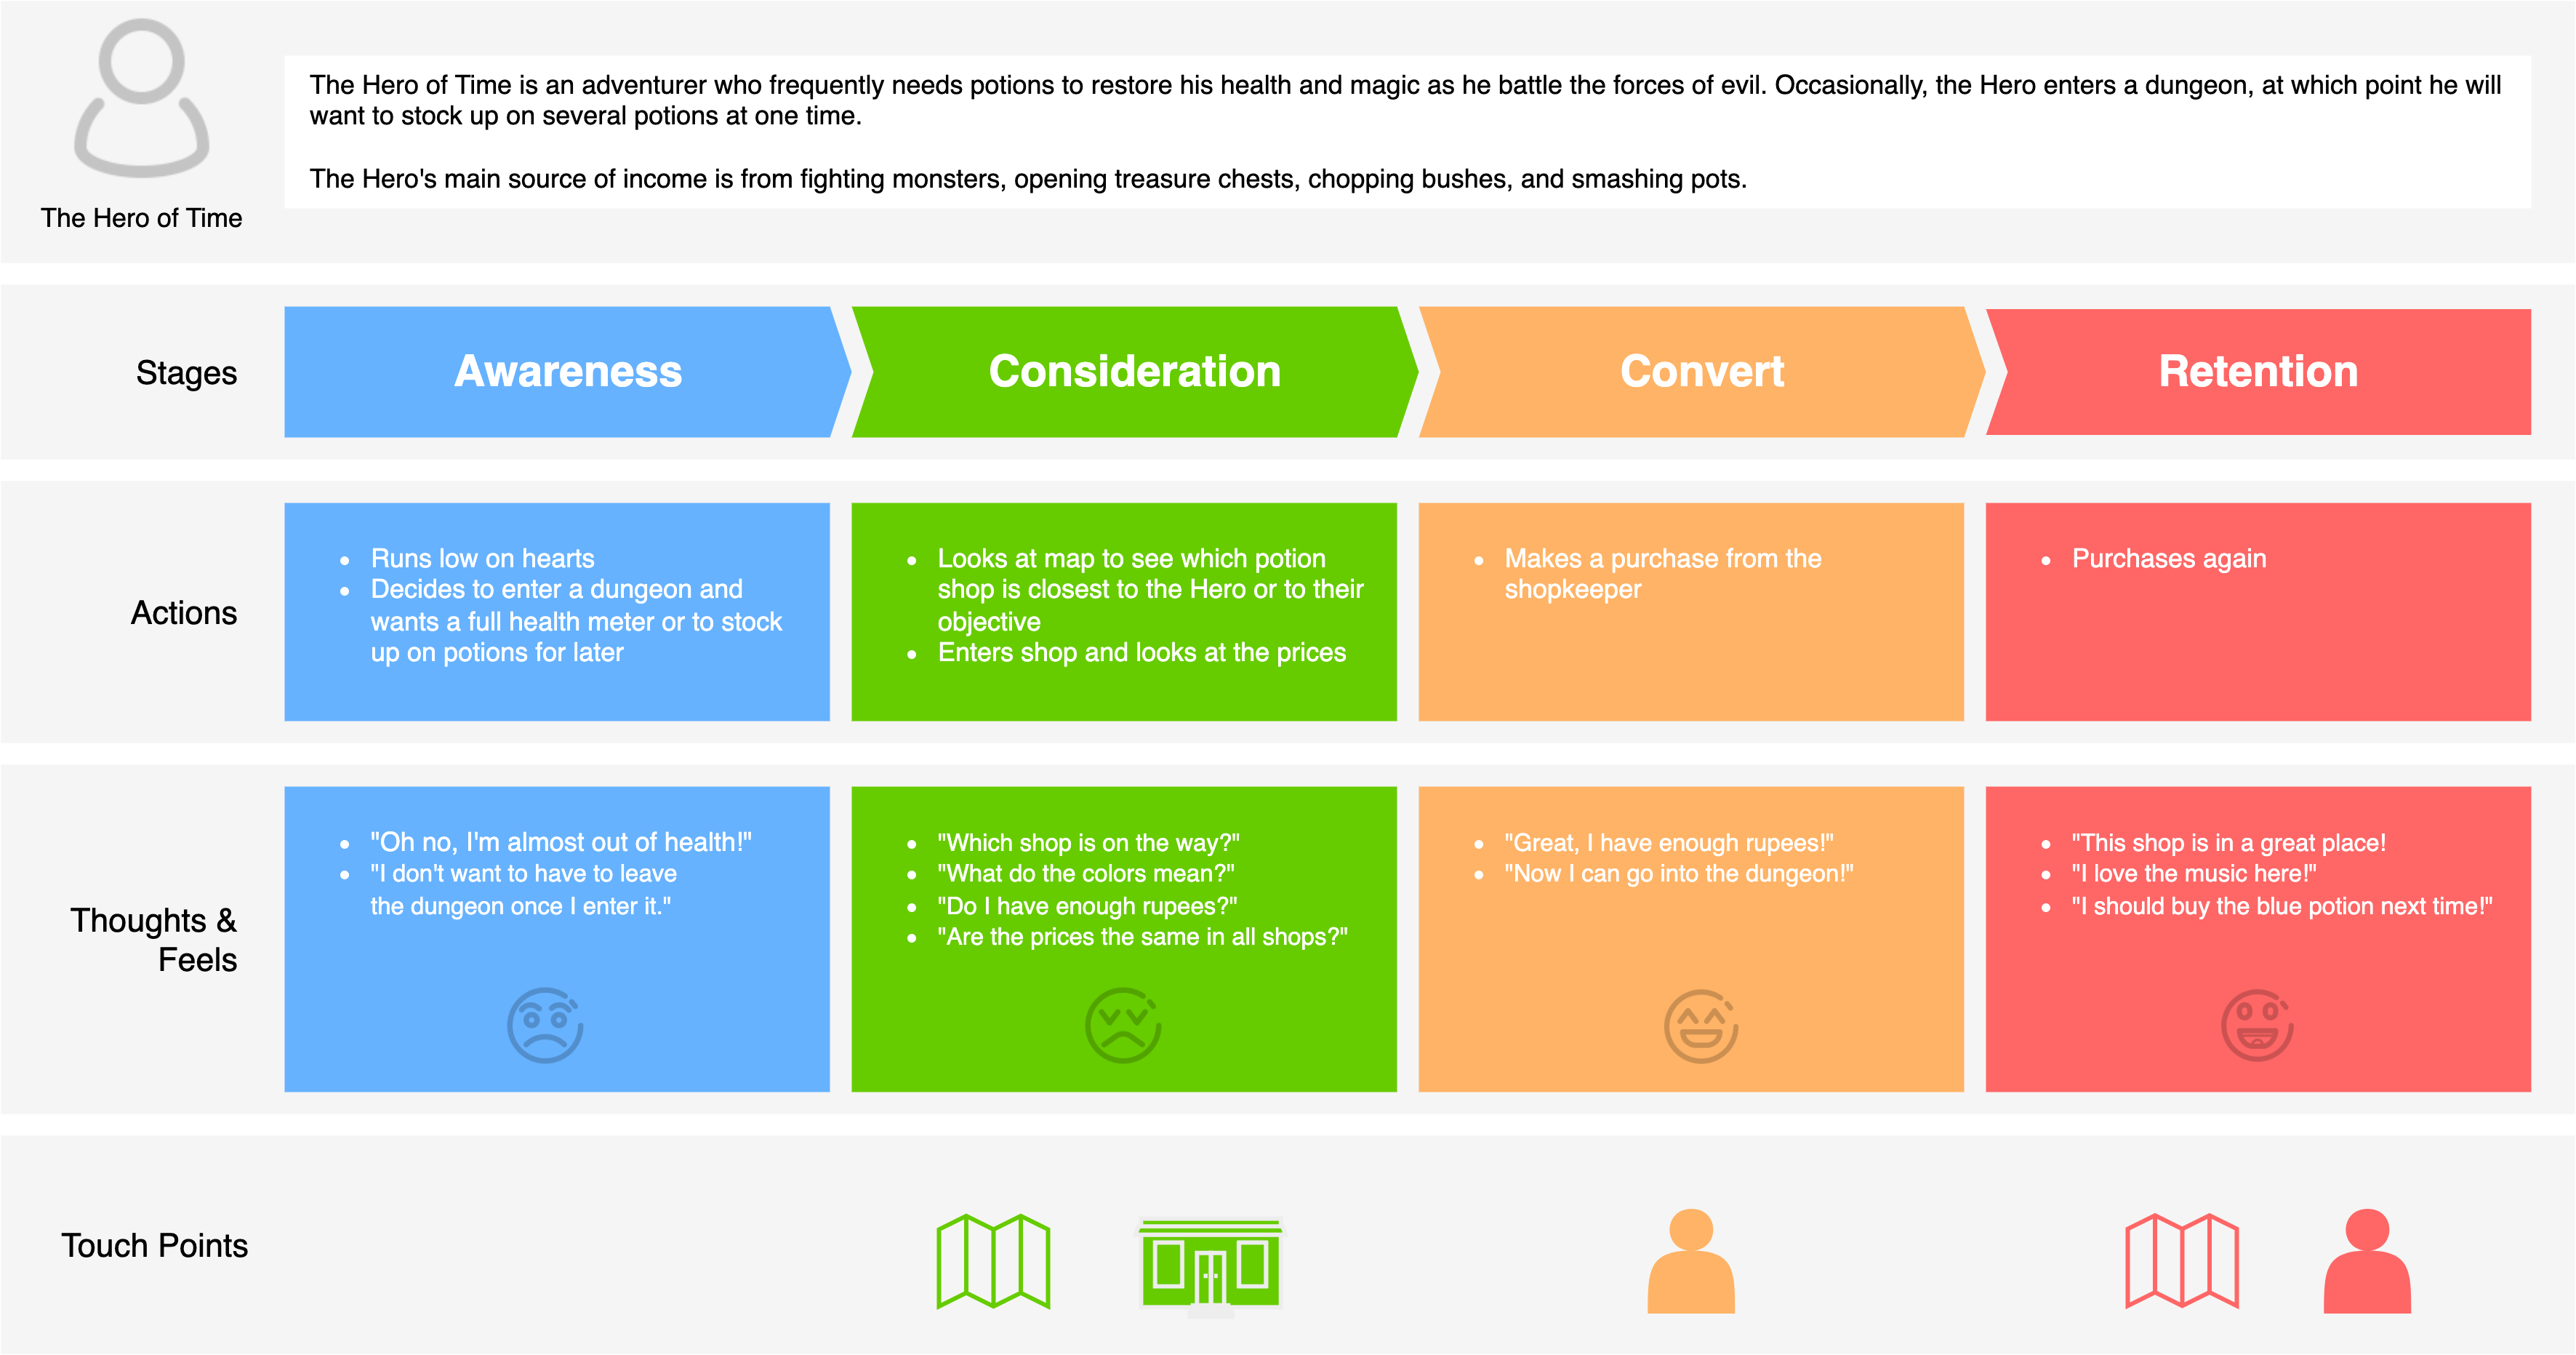
2. Lay out the main stages of the journey
Next, you’ll want to create an axis with the main stages of the customer journey. Some maps also put this at the very top of the diagram, above the persona. There are several different naming conventions for the main stages, and which one you choose may depend on your industry and the product/service you’re selling. While a classic model is AIDA (Attention, Interest, Desire, and Action), more modern customer journeys often include additional steps to capture the journey of e-commerce users, including Comparison, Retention and Advocacy.
Clicking on the “arrow” drop-down in the left-hand menu will give you several options for shapes to use for the stages. Give each stage a separate color and a label—this is a great place to bring in a pop of color that will help your audience understand the map at a glance.
3. Actions
These are the main actions that your user takes in their journey. This usually starts with developing an awareness of their pain point, and can include seeing an ad, comparing products, reading reviews, purchasing your product on a website, writing a review and so on. Since you’re sharing the journey of a specific persona, this should be limited to the actions they would take in their typical journey. For our diagram, we’ll create some colored squares that match each stage of the map and add the actions as bullet-points.
4. Emotions/Thoughts & Feels
The actions a customer takes are always informed by emotions, positive or negative. You’ll want to map the emotions and thoughts that your customer experience at each stage, from frustration at their pain point, to perhaps a sense of confusion as they consider all the different options, and finally to their satisfaction with your product. One way to describe these emotions in a customer journey map is with short phrases from the customer perspective like, “Which do I choose? I’m so confused.” draw.io also has plenty of icons from hearts to emojis to help your customer express themselves.
5. Touch points
Touch points represent the interactions between the customer and your brand. This could be your website, a paid ad, a storefront, an email, or a review/blog post found on another website. Most actions taken by a customer will involve a touch point, and the quality of these interaction will play a big role in the success of their journey. While you can simply add in your touch points as text, we’ll represent the touch points visually with draw.io’s suite icons. Searches for “social media”, “website” and “email” and so on, will net us dozens of options.
- Open Confluence.
- Open draw.io (blank diagram or whitepaper).
- Drag & drop your XML file into your blank drawing area.
- Use it as a custom template if you like.
Other Elements
While the above are the basic elements of most customer journey maps, you may want to add some other sections to express the specifics of your industry:
- People and Environments – If your customer journey involves a lot of person-to-person interaction, say with a sales team, or the staff at a restaurant, you may want to include who is accompanying them on their journey at each step.
- Proposed changes – One reason to create a customer journey is to improve what is currently in place. Add a description of how you could make each action, touch point or stage better.
- Line graphs – One way to visualize the ups and downs of a customer journey is with a line graph. The most common use is to chart the customer satisfaction or happiness with each stage. You can design line graphs in draw.io by using line shapes and icons.
Make your customers’ journey a magical one
With your map in place, you’re ready to educate your team, streamline sales, and improve the overall customer experience. draw.io gives everything you need to design your customer journey map right in Confluence. You can start your own diagraming journey today by trying draw.io for both Confluence and Jira. Just visit the Atlassian Marketplace to start your free 30-day evaluation.
Do you like to dive deeper into the world of draw.io? Access our linktr.ee page to follow us on Social media and learn how others use draw.io and hopefully pick up some tips and tricks.
Happy diagramming!
Last Updated on February 23, 2023 by Admin