You may have heard about the Jobs to Be Done theory – it is being used by some of the larger successful IT companies, including departments at Google, Cisco, Intercom and Basecamp. It’s a way to laser focus your product and service development directly on what your customer really needs in order to get their ‘jobs’ done.
What is the Jobs to Be Done theory?
“Job” is shorthand for the goal that a customer wants to achieve. It’s more than just a straightforward task, it’s also includes the situation and the experience the customer wants to have.
It is easy to get shallow and non-detailed answers and statistics when you directly ask your customers “What do you want?”, “Why do you want it?”, and “Which product do you prefer?”. But these answers lead to misdirected or inappropriate products and services (solutions). The Jobs to Be Done method lets you dig deep in your customer interviews to find the true, underlying motivations for why they purchase the solutions they do.
You will collect a lot of information from your customers as you follow the JtBD method:
- The emotional reasons that drive them to purchase one solution and avoid another.
- The fears that hold them back from switching solutions.
- The circumstances that pushed them to look for and purchase a solution.
- How they found out about the solutions they purchase.
- What characteristics they use to compare solutions.
- …
It’s impossible to get a clear picture of your customers’ Jobs to Be Done without analyzing the mountain information you collect and presenting it visually. One of the earliest diagrams that are used in this method illustrate forces.
Jobs to Be Done – Force diagrams
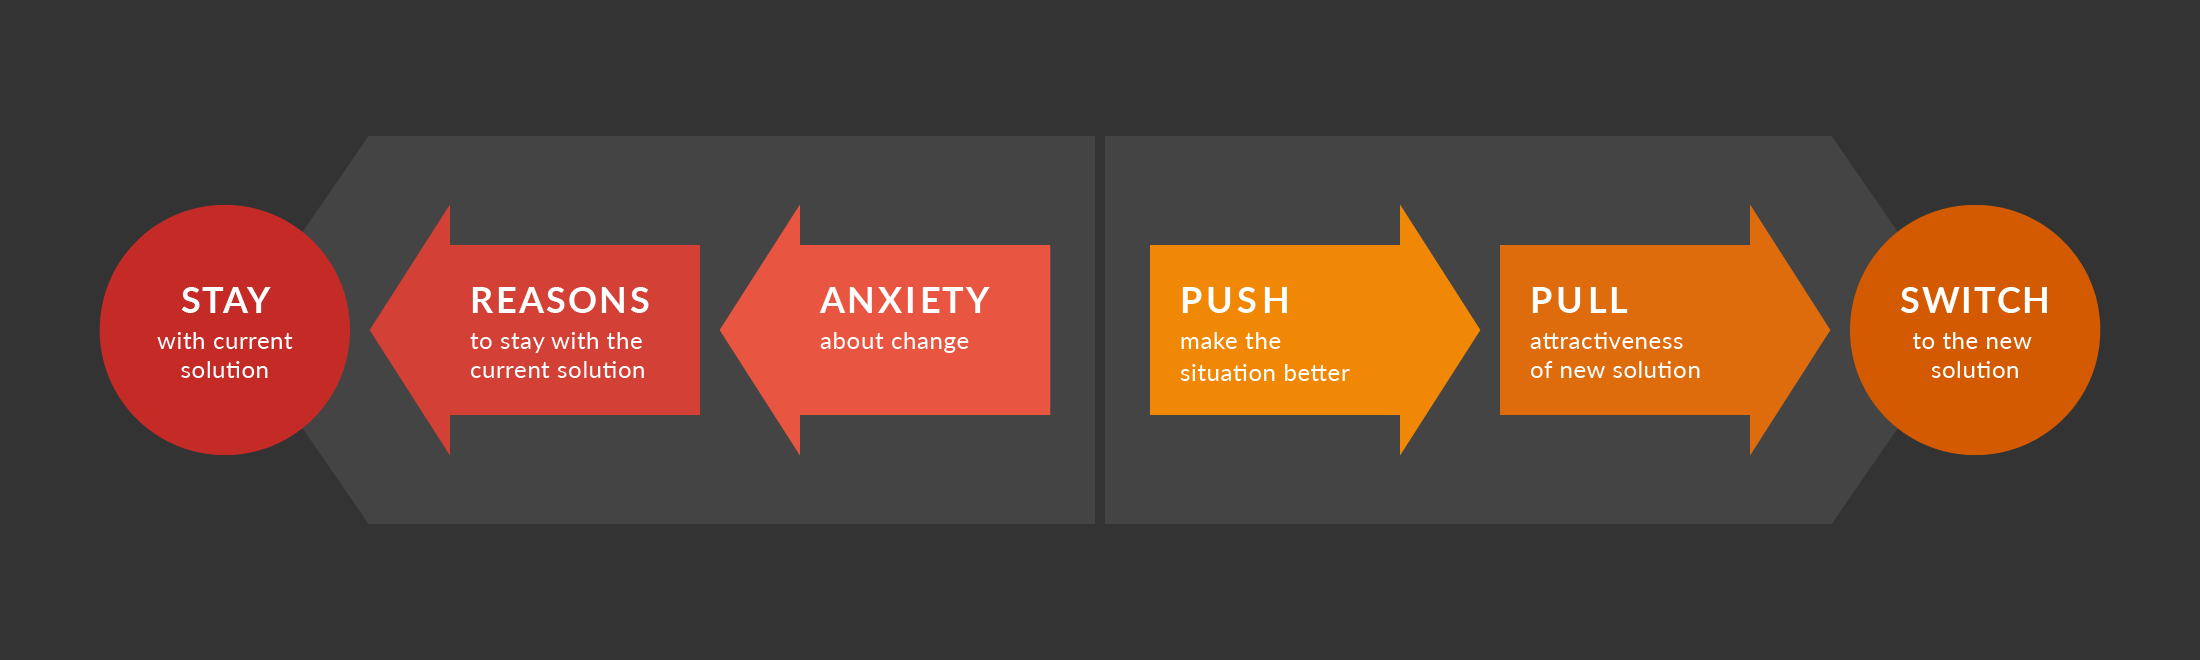
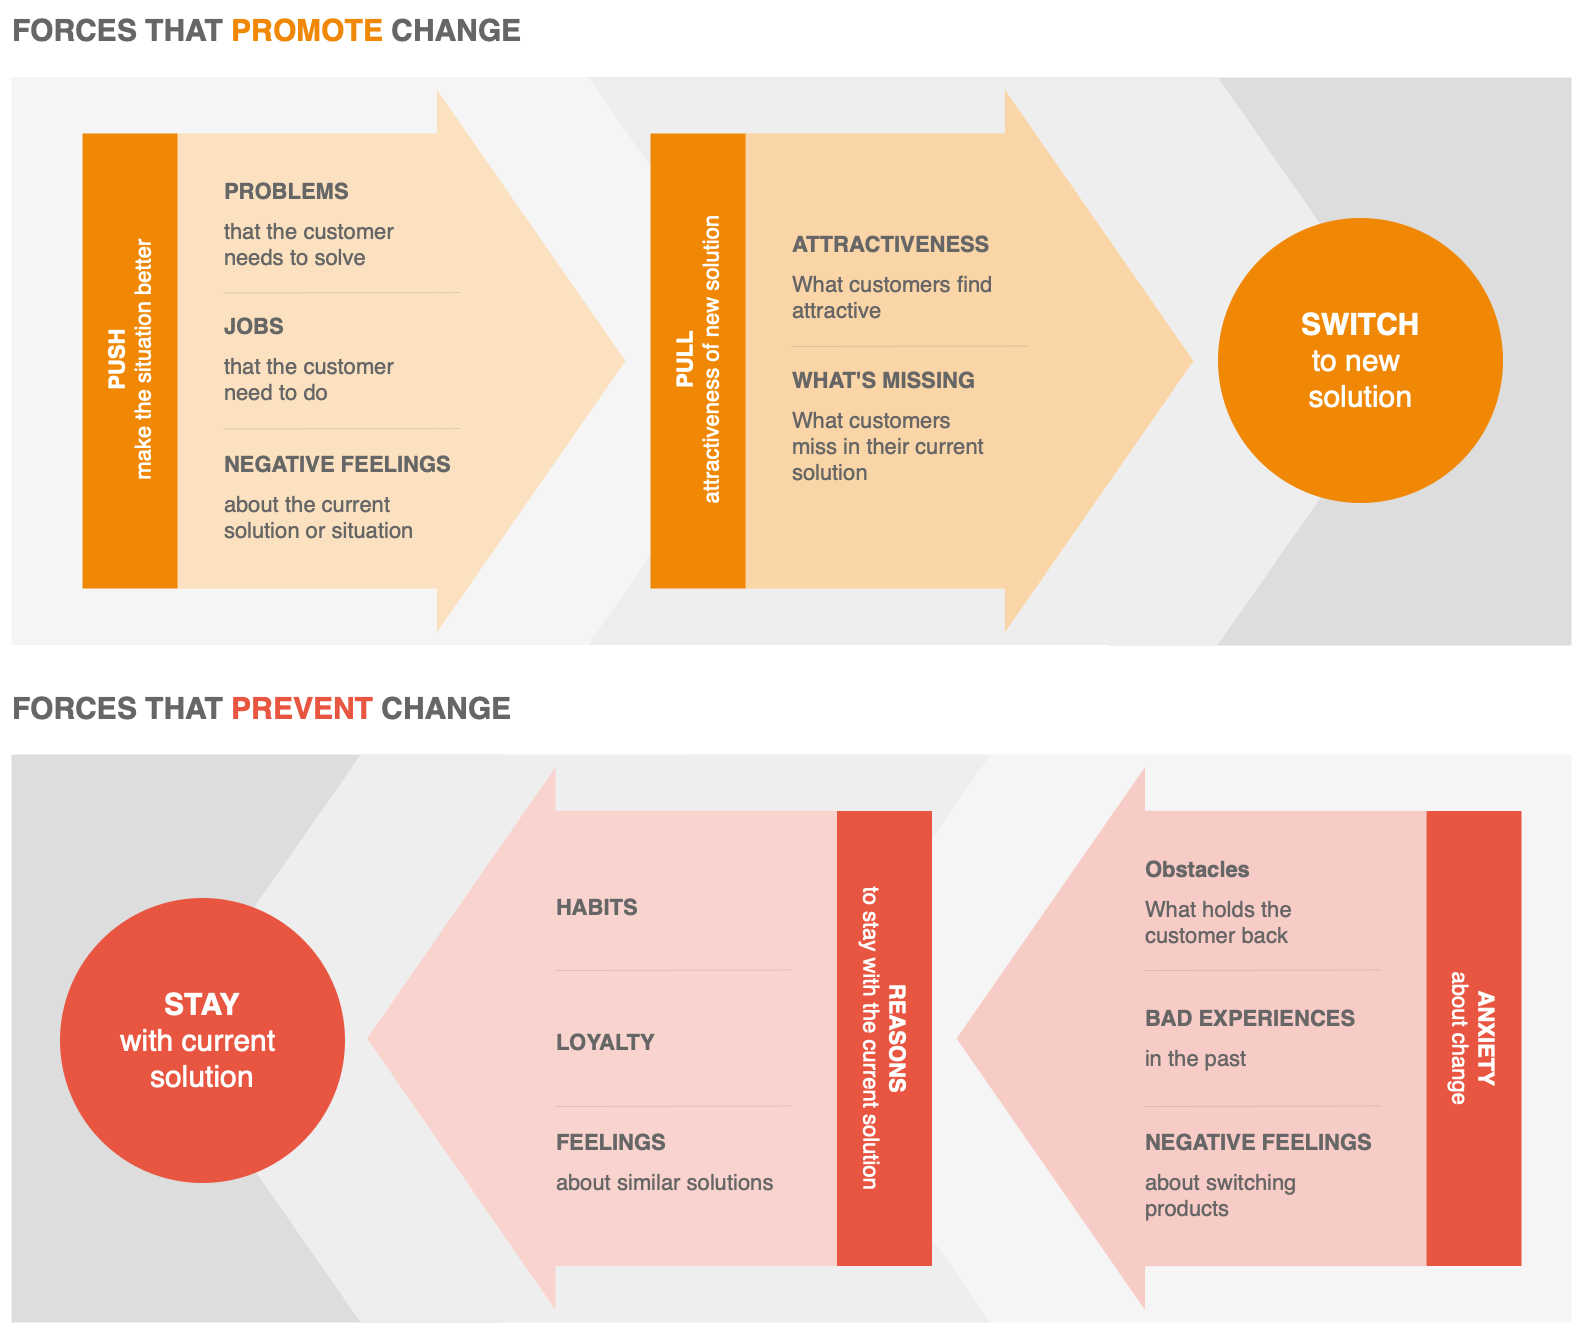
Whenever a customer considers a product or service, there are forces at work. These forces are what drive them to either purchase a solution, or stick with their current solution.
- Frustration with the current situation pushes towards a new solution.
- Attraction to the new solution pulls the customer to choose it.
- Fears can hinder a customer’s purchase – fear of change, fear of not making the right decision, etc.
- Other reasons may hold a customer to their current solution – loyalty, other integrated tools, etc.
You can represent this in diagram form:
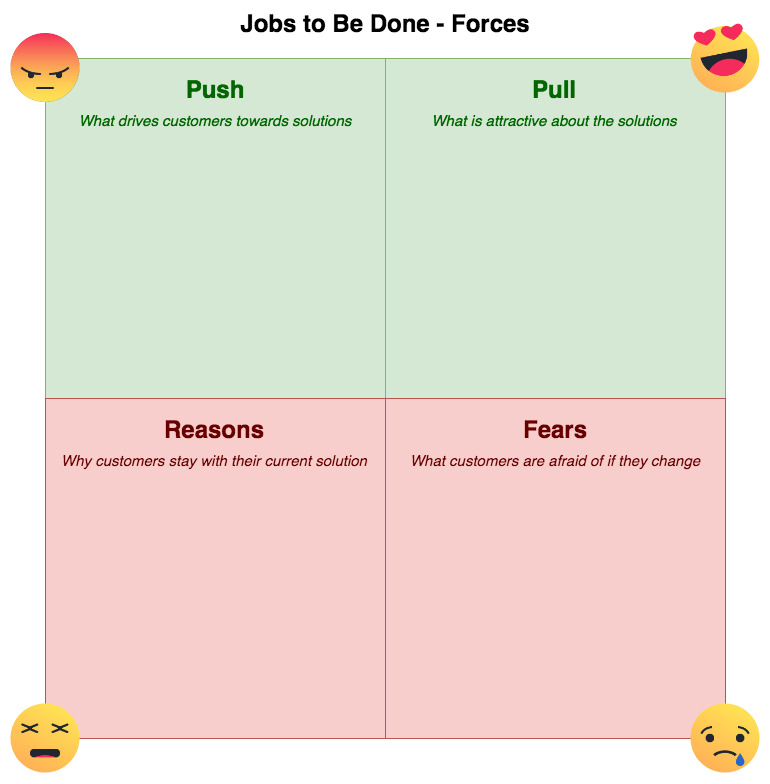
Want to work with a simpler diagram?
Attractive diagrams help you increase engagement and enthusiasm in your internal teams. But they do take more time to create – you can use the diagram above as a template, or you can use a very simple four-quadrant version.
What other diagrams are used in JtBD?
A huge variety of diagrams are used throughout the entire process:
- to help you analyze your customer research
- plan your development
- prototype and test these with your customers
- document the implementation
- improve all of the processes surrounding your customer’s experience
We’ll cover some of the other diagram types commonly used in JtBD, and explain why they are helpful.
Want to learn more?
The Jobs to Be Done website by the founders of the method, Chris Spiek and Bob Moesta is packed with information, especially their blog posts and interviews with people who are using the method in their daily work.
The detailed white paper, Intercom on Jobs-to-Be-Done, explains how the method is helping Intercom innovate.
The Harvard Business Review provides examples showing why Jobs to Be Done is a better method than what is typically used to discover customers’ pains and gains.
draw.io helps you get your jobs done
It’s the job of teams to help their customers get their jobs done. Atlassian Summit 2018 was all about helping and celebrating teams, and as we were a Diamond sponsor, we took the opportunity to craft a white paper explaining how you can use diagrams to improve the Jobs to be Done approach.
Help your teams focus on helping your customers get their jobs done!
We’ve already covered how you can create the Jobs to Be Done force diagrams with draw.io, and now in this post, the value proposition canvas. Next up will be customer journey maps – stay tuned!
Last Updated on April 9, 2020 by Admin