The Unified Modeling Language or UML notation is probably the most well known and regularly used visual representation of programs that you’ll find in software development. There are a wide range of diagrams to help you specify your data and processes before you start programming. They help you clarify requirements and limitations, speed up the implementation, provide a guide for thorough testing, and prevent bugs from sneaking in throughout the entire software development process.
If you aren’t using them, why not? 😉
In previous posts, you have seen two examples of behavioural diagrams (use case models and activity diagrams). I’d like to jump to the other category of UML diagrams – structural diagrams. Probably the most well known structural diagram are class diagrams, which specify the data structures and their relationships within your program.
Of course, you can develop the different UML diagrams in the order that you prefer. But as you work on later diagrams, especially those in the other category, you’ll almost certainly find you have missed things. It’s perfectly normal to need to correct or modify your earlier diagrams – think of it as parallel diagramming!
Class diagrams are not just used for programming
For example, business analysts can model the company structure of assets and processes associated with them.
UML class diagram notation
Unsurprisingly, your program’s classes go into a class diagram, including their attributes (variables) and methods (functions). These diagrams form the foundation of object oriented programming.
Classes
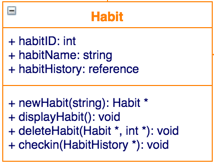
Each class is represented by a box with three sections stacked on top of each other with the following formatting. Only the class name is mandatory
- Class name
- Attributes – name: type
- Operations – method name(parameter list): return value type
Taking a look at the Habit Tracking app example that I used in earlier posts, you’ll see each Habit has several attributes and operations.
Tip: The symbol before the attribute or method name indicates its visibility – public (+), protected (#), private (-), derived (/) or package (~).

Inheritance
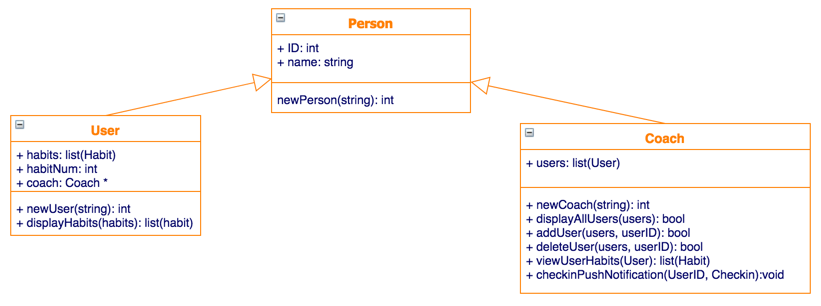
When a child class has the same operations and attributes as its parent class, but adds some of its own extras, that’s inheritance. Inheritance is a core feature of object oriented programming. You can indicate this in your diagram by drawing an unfilled arrow from the child class to the parent class.

Tip: Abstract classes can be indicated by italicizing the name of the class.
Associations
When a link exists between classes you can indicate it in a number of ways.
- Bi-directional: Both classes know about the association – draw a solid line between the classes, with no arrows.
- One way: Only one class knows about the other – use an open arrow head. For example: a FailedStudentsList will know about the Student class, but the Student class is not aware of the FailedStudentsList class.
- Dependency: When changes in one class cause changes in another class, they are dependent. Use a dashed line to show dependency.
- Aggregation: When one class contains several instances of another class, but those instances still exist even if the container class is deleted, then that’s aggregation. Use a hollow diamond to indicate the container class.
- Composition: This is similar to aggregation, but when the container class is deleted, the instances of the other classes are also deleted. The container class is ‘composed’ of instances of the other class. Use a solid diamond to indicate the container class.
- Multiplicity: Where you indicate how many of each class is related to the other class. This can be zero or more (0..*), one-to-one (1..1), or 1 to a specific number (1..5).
There are many other ways to indicate associations, including association classes, reflexive associations, packages, and more. For a comprehensive look at modelling classes in UML, IBM has provided a great tutorial.
Creating a class diagram in draw.io
I’ve put all of these components together to model the data structures in my Habit Tracker app.
In draw.io, make sure you have enabled the UML shape library – click on More shapes… in the left hand panel, enable the UML shape library, then click on Apply.
draw.io can be used with Jira and Trello
draw.io is available as a Jira app and a Trello Power-Up so you can easily collaborate on your software development and business processes and keep the diagrams with the issues that they relate to. You can collaborate with your colleagues and keep the diagrams up-to-date as you develop all of your requirements and implementation specifications.
Need some help?
- Don’t want to start with the data structure? If you are like me, you may find it more comfortable to start with use case diagrams and activity diagrams – you can easily create these and other UML diagrams with draw.io.
- Are you working on a mobile app? Why not use draw.io to mockup your mobile apps!
- Is this your first time diagramming? Step through our self-directed training course to get familiar with draw.io’s features.
Last Updated on April 17, 2020 by Admin

