Entity relationship diagrams (ERD) or ER models represent the data in any system. You can use them to illustrate how data is structured in business processes, or to detail how data is stored within relational databases. ER diagrams don’t necessarily show how data is manipulated, or the exact process it steps through, but how the data entities are structured and related to each other.
Software developers may be much more familiar with UML diagrams, specifically class diagrams, which were designed explicitly to support object-oriented programming, including features like inheritance, encapsulation and sub-typing. You can think of ER diagrams as a simplified form of the class diagram – and they may be easier for your database design team members to use when building your complex object-oriented program.
What is in an entity relationship model?
There are several ER diagram notations, but the most common are the Chen and Crow’s foot notations.
There are two main styles – one looks more like a flow chart, and the other more like a UML class diagram. It is perhaps easier to see the actual databases represented in the second style.
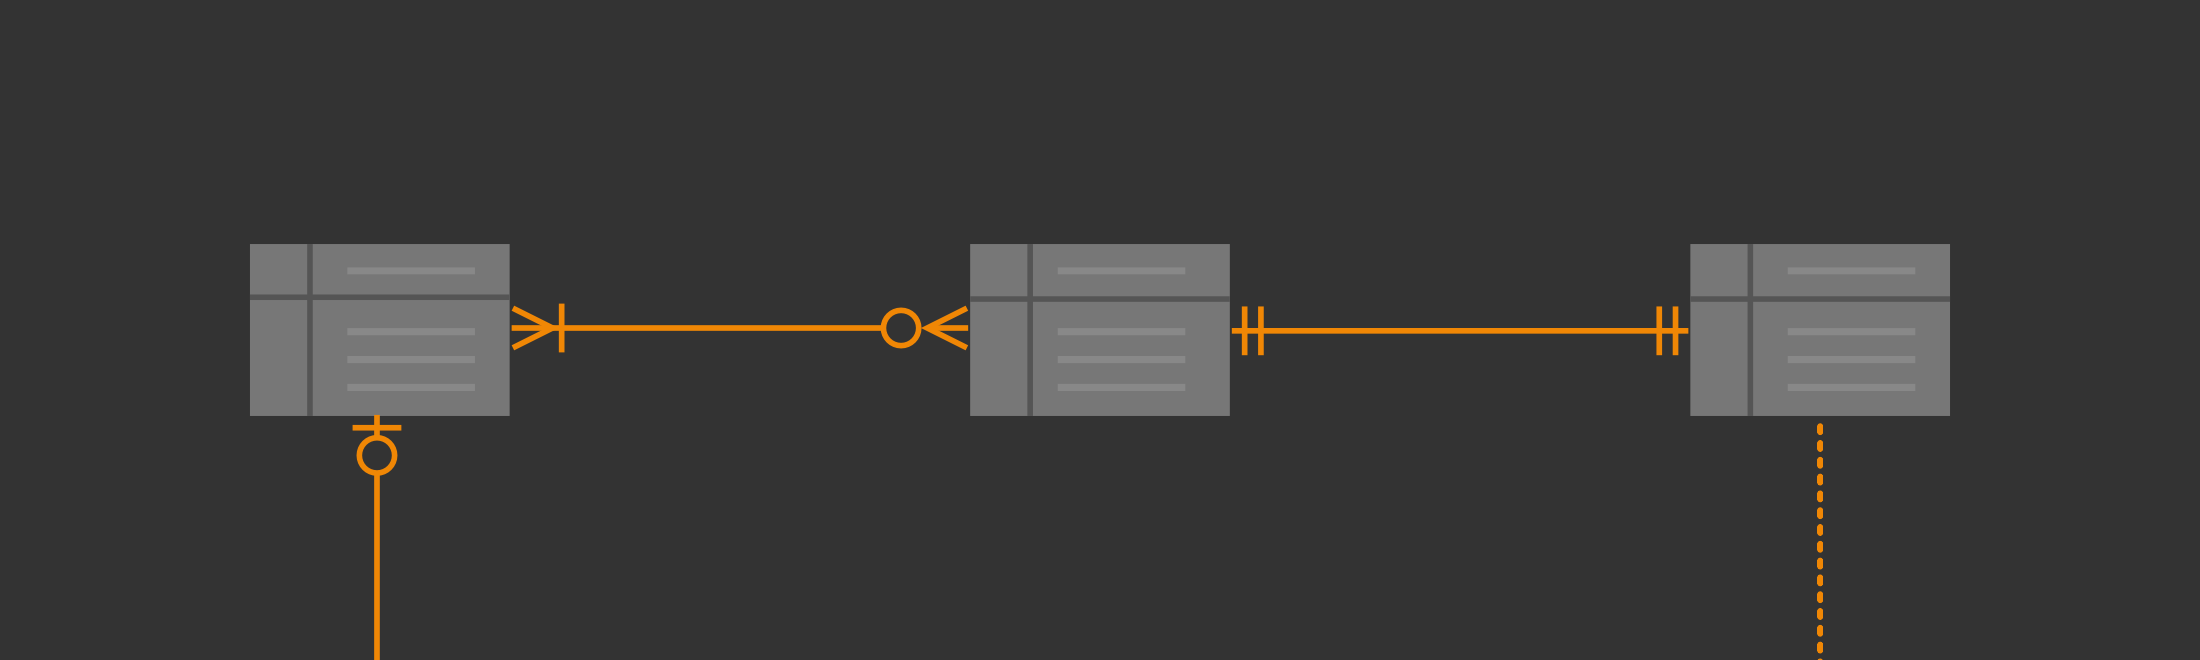
Entity relationship diagram with basic shapes representing the relationships.
The same diagram in a different style – with attributes listed inside the entities themselves.
Entity relationship notation
There are three components in ERDs:
Attributes
The individual bits of data that make up an entity. In the first style of diagram, they are drawn as circles floating around their entity. In the second style, similar to UML class diagrams, they are listed within the rectangle.
If an attribute is used to identify the entity, it is the primary key and underlined. If it refers to the identifying attribute of another entity, it is a foreign key and italicized.
If you aren’t actually storing an attribute, but calculating it from other attributes, it’s a derived attribute, and has a dashed outline.

Relationships
These show how entities are related to each other – they may either be represented with diamonds, or written as text on the connector between the two entities.
In the first style of diagram, you can see that both User and Coach write comments, and the User can perform a habit Checkin, these two ‘actions’ aren’t represented at all in the second style of diagram, which purely represents the data, not any interactions.
Relationship connectors use Crow’s foot notation to show how many of each entity is related to another entity. For example, in the Habit Tracker app – A Coach can have 0 to many Users, but a User can only have 0 or 1 Coach. Users may have many Habits, and each Habit may belong to many users.
Tip: Hover over each shape in the Entity Relation library to see what type it is.


Entity
These represent a collection of data, using a rectangle with attributes ‘hanging’ off it, or box containing a list of its attributes.
For example, an entity Student could include the attributes StudentID, Name, Address, Course, Subjects, Marks. A second entity following this example would be Course, which would include the attributes Professor, a list of enrolled Students, and the Subjects that the Course contains. And so on.
Using the HabitTracker example that I have used in previous posts, the entities are: User, Coach, Habit, Checkin, and Comment.
- A weak entity (shown as a double rectangle), because it doesn’t have it’s own unique key – it only exists in relation to entity to which it belongs.
- An associative entity (easier to see in the second type of diagram), is shown with a dashed outline and connector – this type of entity is needed wherever you have many-to-many relationships. To create an associative entity in the first style of diagram, add an entity shape and a relationship shape, and group the two shapes together.


Create an entity relationship diagram in draw.io
First, you’ll need to enable the Entity Relation shape library: Click on More Shapes at the bottom of the shape library, under the Software section in the dialog, enable Entity Relation, then click Apply.
For the attributes, use the circle from the General shape library.
Connecting shapes to show relationships
You can either drop the connectors from the Entity Relation shape library onto your drawing area, then connect them to your shapes, or duplicate an existing shape – hold down CTRL on Windows, or CMD on macOS then drag a connector from one of the blue arrows that appear when you hover over a non-selected shape, then release to duplicate the shape and automatically connect the two. You can then select the connector and change the start and end connector style using the drop-down lists in the Style tab in the format panel.


When creating ER diagrams with draw.io
Use sliding connectors: When drawing connectors for relationships, make sure you hover over the shape until the outline turns blue – don’t connect it to one of the connection points. This way, when you drag the shapes around to make room, the connectors will ‘slide’ or ‘float’ into the right positions.
If you don’t want the connectors to slide around the shape perimeter, you can attach them to the fixed connection points (small crosses, highlighted in green when you hover over a shape).
Use template shapes: Use the scratchpad for storing groups of shapes so you don’t have to build each up from scratch. If you are creating the second style of ER diagram, you can store a ‘template’ with as many extra ‘rows’ for the attributes as you typically need. See this earlier post for a more detailed description on how to use the scratchpad in draw.io to make creating ER diagrams quick and easy.
Export to text: Want to create a text list of entities and their attributes and keys? Use the draw.io text plugin and export it to a text file. This works better with the second style of diagram.
Add extra attributes to entities: Sometimes your entity shapes don’t have enough space for all the attributes you need. The easiest way is to duplicate an existing attribute row. Select an existing row and press CTRL+Enter (or CMD+Enter on MacOS) to duplicate it. You can also right click on the row shape, select duplicate, then edit the text. Of course, you can also drag new attribute rows from the shape library and drop them within the entity shape.
Edit an attribute row by selecting it, then pressing Enter. When you’ve finished, press CTRL+Enter (CMD+Enter) to exit the text edit. Use the arrow keys to move to the next entity or duplicate it by pressing CTRL+Enter (or CMD+Enter on MacOS).


Use multiple pages for your diagram: You don’t have to fit everything on one page. Give each sub-diagram its own page in draw.io and add links from a shape to its page to help readers navigate your diagram: Right click on a shape, select Edit Link, select the appropriate page from the second drop down list, then click Apply.
Expand or collapse the entity: Some entities have many attributes. To simplify your diagram, you can expand or collapse the entity – click on the minus or plus icon at the top left of the entity’s title. The connectors will reroute automatically.
Inserting entities from a text file: You can insert entities directly from SQL code – click on Arrange, then Insert, then Advanced, then From Text. In the dialog, select Table from the drop down list. You’ll see example code – paste in your SQL, then click Insert.
Related information
Are you more comfortable using class diagrams when developing software? Have a look at how to create UML class diagrams in draw.io.
Do you need some help getting started in draw.io? Step through this draw.io tutorial to learn how to use shapes, the shape libraries, and connectors.
Last Updated on August 18, 2023 by Admin