State diagrams have been used in programming to describe the various possible states that a system can be in for decades. They also quickly show which states lead to each other, and what triggers a change of state.
Of course, you can use these diagrams for anything system or process that has various states – library books, a publishing process, even punishment and reward states for your kids. They are very similar to flow diagrams, but UML has a notation specifically for state diagrams, which they also call state machines or statecharts.
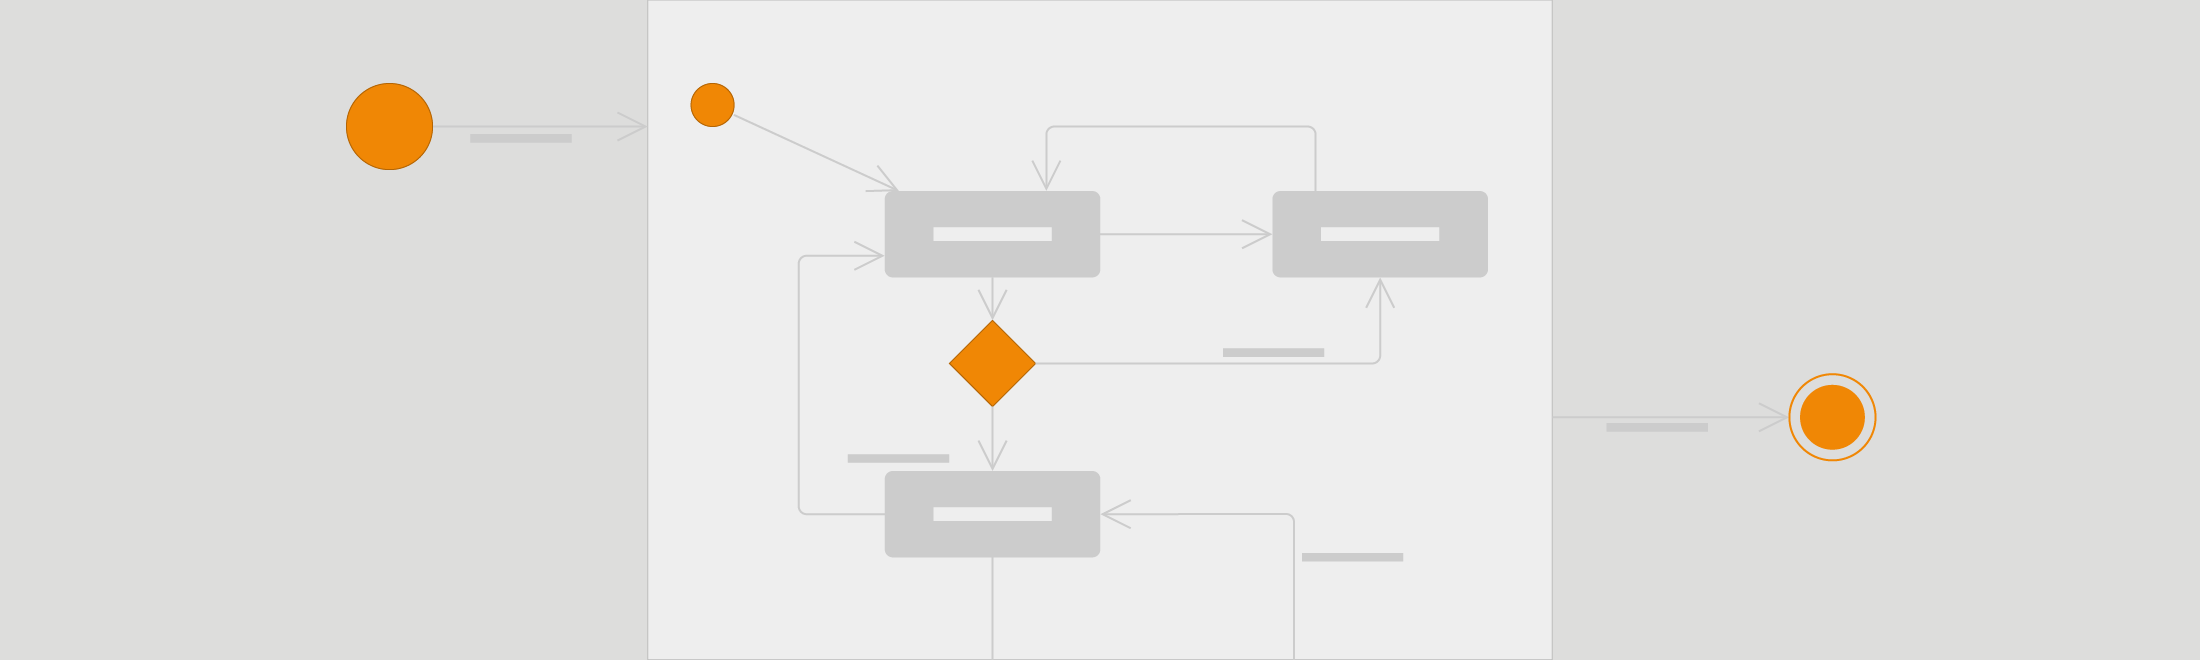
State diagrams in UML notation
The biggest difference between state diagrams and activity or interaction overview diagrams is that state diagrams do not (necessarily) show the sequence. They just show what states are possible and their entry and exit points, not when those states are entered.
State diagrams can be very complex – you can nest state diagrams, put guards (true/false) before a state, add actions triggered by a state change, and even defer events to be processed at a later time. These diagrams can get very text-heavy, and the conditions are usually written for one specific programming language. This may make the diagrams complex to look at, but it can also make programming (and testing) faster as there is less room for misunderstanding.

Components of UML state diagram
UML state diagrams use a notation that you may have already seen in our UML activity diagrams.
- Start state: A solid circle.
- End state: A solid circle with a ring around it.
- State: A rectangle with rounded corners, with the name of the action.
- Transition: Connector arrows with a label to indicate the trigger for that transition, if there is one.
- State with internal activities: A state with a horizontal line, and the actions listed in the bottom half.
- Composite state: A state with a horizontal line, and a nested state diagram (or link to another draw.io page) in the bottom half.
- Guards or conditions: A diamond.
- Fork: A thicker line with one transition incoming and two or more outgoing.
- Join: A thicker line with more than one transition incoming and only one outgoing.
Tip: UML 2 state diagrams use the clear black/white shapes, and UML 1 has yellow shapes with a red outline. I personally find UML 2 easier to read.
Enable the UML shape library
In draw.io, all the shapes you need for activity diagrams are in the UML shape library. Click More Shapes … at the bottom of the left-hand panel, then enable the UML shape library and click Apply.
Find shapes even faster: Even if you don’t have the UML library displayed, you can search for “state” in the left-hand panel, and it will show you the shapes you need to create a state diagram (as well as a few others which are related to ‘states’ in other diagram types).
The different between forks/joins and guards
Guards represent decisions based on conditions, similar to those in flow charts. In the simple example below, the guard checks whether fees have been paid. If yes, it continues to the next state. If no, it aborts the entire enrollment.
Forks and joins occur where there are two or more parallel things being done in a program – concurrent states. If there is a fork, there will be a corresponding join where the different ‘threads’ will synchronize. In the simple example below, both undergraduate and postgraduate students are assigned a student ID (university administration), which happens at the same time as assigning a postgrad supervisor (faculty administration).


UML state diagram for the Habit Tracker example
Continuing with the same example used in the previous UML diagram posts, I’ve created a state diagram for when a user is logged into the Habit Tracker. You can se that it is similar to the activity diagram (displayed after the state diagram).
Because this example is simple, and contains no parallel actions or states, it wouldn’t make sense to use both types of diagrams. In reality, most software is highly complex, and sometimes state diagrams will be needed in addition to (or instead of) activity diagrams.
State diagram for the Habit Tracker example – open this diagram in draw.io
Activity diagram for the Habit Tracker example – view blog post
UML diagrams in draw.io
In addition to state diagrams, you can create all of the other UML diagram types easily with draw.io:
Is there a UML diagram type you love using, but we haven’t demonstrated it? Let us know on Twitter! Want to hear how others are using draw.io? Read about how Solution Architect, Marcel Grossert, uses draw.io to visualize his workflows!
Last Updated on October 1, 2020 by Admin