Looking beyond the code
As a computer science major, you’ll be introduced to a vast number of diagrams, and you’ll quickly learn that designing and defining systems requires strong visual representation.
Your diagrams need to present complex information in a digestible way to an audience with varying levels of technological and programming knowledge. This is not only true for students tasked with presenting visualizations to their study group or teachers/professors; it is also true later on in the workplace, where you often present what you are working on to various stakeholders across the company.
draw.io’s versatility will give you a helping hand by enabling you to easily and efficiently create technical diagrams to suit your needs. Building your draw.io diagrams within Confluence will take them even further, opening up possibilities like embedding diagrams within pages of text, and collaborating with others on diagrams in real time.
Using draw.io in Confluence is free for up to 10 users: click the button below to try it today, or find out more about using what Confluence is in our related blogpost.
Today, we will be showcasing three diagram types that every computer science student should know, and how to build these in draw.io.
ERD – as easy as 1, 2, 3
Entity relationship diagrams (ERD), or ER models, show the logical structure of databases, and highlight the interrelations between specific concepts, or entities, (these can be objects, people, places, etc.) in a given topic area. These diagrams are commonly used to demonstrate business processes and are an integral part of many applications.
To build an ERD in draw.io, use our Entity Relationship Diagram template to get started.

Once you have loaded the template:
1. Head to + More Shapes at the bottom of the left sidebar.

2. Select Entity Relation from the side menu, under the Software category.

3. The Entity Relation shape library will appear in the left sidebar, ready for you to use.

The loaded ERD template with the Entity Relation shape library in the left sidebar
Customize your ERD by adding table rows, rounding the corners of your table, and adding colors to emphasize certain sections.
For more information on entity relationship diagrams:
- Check out our dedicated article on Entity Relationship Diagrams with draw.io
- Follow our step-by-step YouTube video to Create Entity Relationship Diagrams (ERD) with draw.io
Network Diagrams – keep everything connected
Computer network diagrams document all the key components that make up different network types. These diagrams are heavily dependent on symbols that quickly show users the network layout, and how everything is set up and connected.
When building your own you can either start from scratch, or choose from one of the 13 network diagram templates.


The loaded Active Directory template with the Networking shape library in the left sidebar
We offer a diverse range of diagram shapes to visualize networking systems like AWS, Azure, Kubernetes, and more. These are found under + More Shapes > Networking.

UML – U Might Learn something!
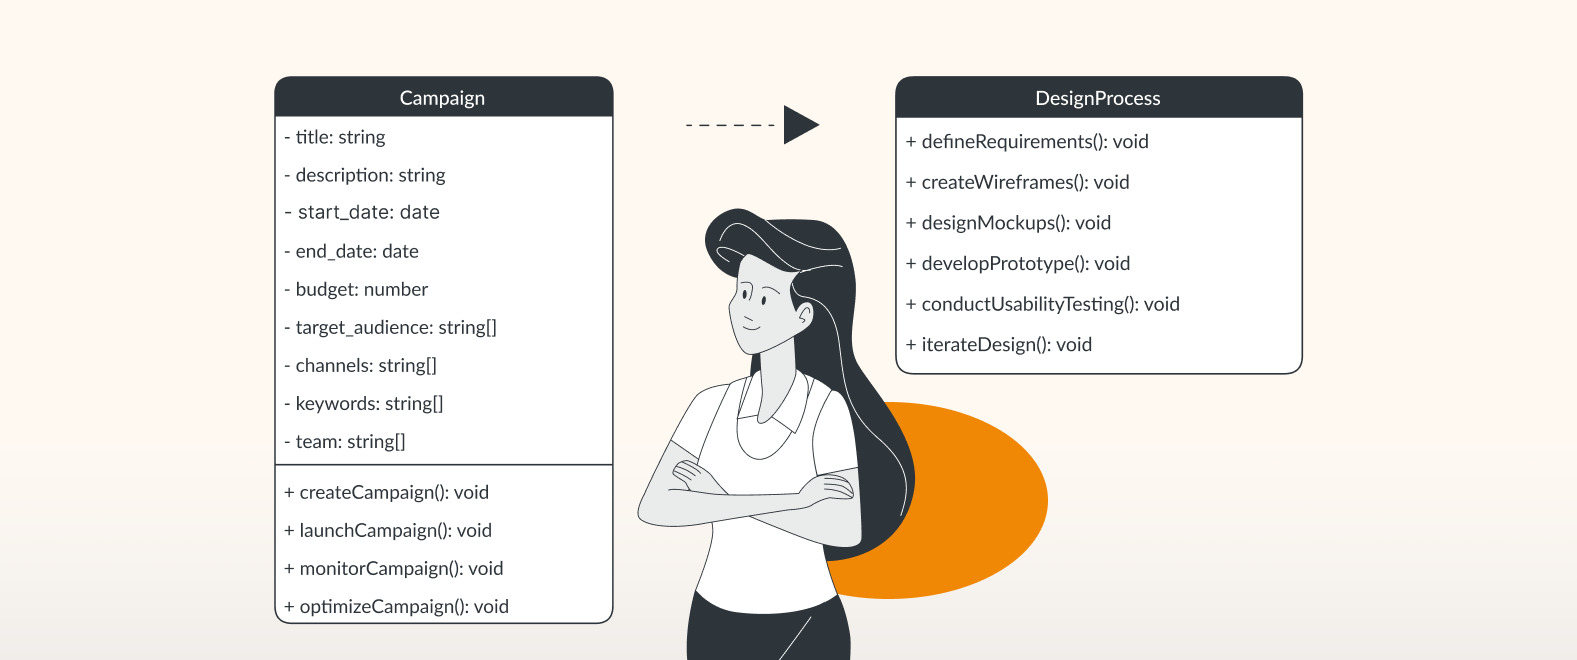
UML, or unified modeling language diagrams, visually represent object-oriented systems that outline system architecture, behaviors, and interactions. It’s a staple for software design and system engineering. Examples include class diagrams, sequence diagrams, and use case diagrams.
There are eight UML diagram templates to choose from, to get the ball rolling.

Our blogpost, UML diagrams – which diagram to use and why, contains links to key information, templates, and step-by-step guidance, depending on the type of UML diagram you are looking to create.
Once you have built your UML diagram, show your diagram some love. Our article, I 🧡 draw.io –Three ways to improve your UML diagrams, provides all you need to know to make your UML diagram the best it can be.
User flows – take users on a journey
We mentioned we’d be showcasing three diagrams in this blogpost, but we’ve decided to be generous and throw in a bonus diagram!
With a future in computer science, understanding user flows is crucial, particularly if you are thinking about venturing into the realm of UX/UI design. User flows capture the steps an individual will take in your app or website, like purchasing a product, signing up for an account, or accessing a particular feature. You don’t want blindspots in your user journey – mapping out these flows can quickly show obstacles that customers face when using your software, as well as any missing or redundant steps in the process.
If you have a user flow in mind, save yourself a ton of time creating this by using our Smart Template feature. This will give you the building blocks you need, which you can then personalize further by adding in steps, applying colors, and changing the layout and connections as you see fit.

For more inspiration, our related article, Create user flow diagrams in Confluence, contains further use cases and customization examples.
Stay in the loop
Over the next few weeks, we’ll be showcasing more ways draw.io in Confluence and Jira can help you during your studies – so keep an eye on our blog!
Some of the topics already covered, and ones that we will be covering in detail, include:
- Confluence, Jira, and draw.io: the ultimate student toolkit
- The student’s guide to group project greatness, with draw.io
- Visualizing an A+: diagrams for note-taking and exam prep with draw.io and Confluence
- Let your ideas flow with draw.io: designing a scientific experiment
- Don’t short circuit: use draw.io for your electrical diagrams
- 2 diagrams every business major should know
- Eat the elephant: breaking down ideas for your final dissertation/ thesis
Want to dive deeper into the world of draw.io? Access our linktr.ee page to follow us on social media and learn how others use draw.io, as well as pick up some helpful tips and tricks.
Not using draw.io yet? Convince yourself and start your free 30-day trial today. Or book a free no-obligation demo with our customer success team to learn more about how draw.io can make life easier and more productive for you and everyone in (and outside of) your company!
Happy diagramming!
You are currently viewing a placeholder content from Youtube. To access the actual content, click the button below. Please note that doing so will share data with third-party providers.
More InformationLast Updated on October 12, 2023 by Admin